Download
1 / 41
410 likes | 434 Vues
Discover how to measure and optimize your chi, or human vitality, using the Seven Circles Model of Wellness. Explore the factors affecting vitality, the dimensions of human vitality, and practical applications of this integrated model.

E N D
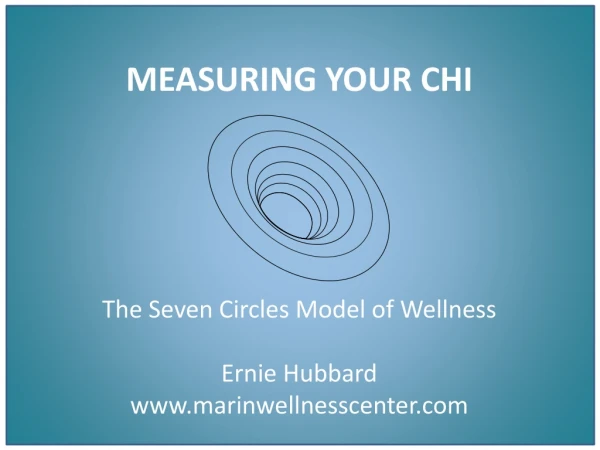
MEASURING YOUR CHI The Seven Circles Model of Wellness Ernie Hubbard www.marinwellnesscenter.com
Marin Wellness Center • Website • E-book • Videos • Workshops • Local and Remote • Cross-referrals • Collaborative Research
WHAT IS “CHI” IN THE CONTEXT OF • HUMAN VITALITY? • Health? Wellness? • Longevity? Life Span? • Energy? Fitness? • Joy? Peace? • Creativity? • Can Chi be measured? If so, How?
MAJOR FACTORS AFFECTING • OUR VITALITY Genetics Environment Overall Vitality + =
THE LONGEST-LIVING ANIMALS • ON EARTH LIVE IN THE SEA Genus: Porifera (Sea Sponges) Most primitive animal species Carbon-Dating Studies 28,000 years + Implications: Cellular Repair & Regeneration But why?
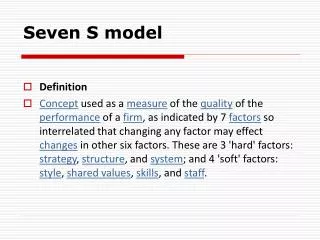
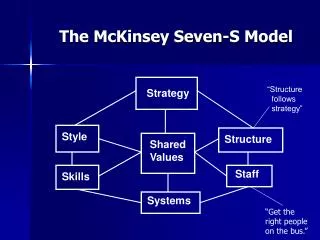
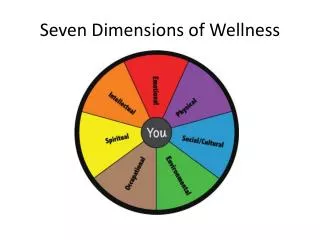
THE SEVEN CIRCLES MODEL OF HUMAN VITALITY Energy (pre-cellular energy & ions) Cellular (core building blocks) Membrane (tissues & organs) Physical (strength, endurance, flexibility) Integration (mind-heart-body) Relational (family, friends, community) Spiritual/Creative (our highest calling) Energy Cellular Vitality Tissue/Organ Vitality Physical/Body Vitality Mind/Body/Heart Vitality Relational Vitality Spiritual/Creative Vitality
FACTORS AFFECTING VITALITY THEN & NOW + + + + - - - - - - - + + +
OUR GOAL: RESTORE ANCIENT CONDITIONS FOR OPTIMAL VITALITY + + + + - - - + + + + - - -
COMBINING DIMENSIONS & CAUSES 2-DIMENSIONAL MODEL OF HUMAN VITALITY 49 X = 7 Dimensions of Human Vitality 7 Factors Affecting Human Vitality 49 Opportunities to Optimize Human Vitality
2-DIMENSIONAL MODEL OF HUMAN VITALITY Factors Dimensions
2-DIMENSIONAL MODEL OF HUMAN VITALITY Factors Dimensions
LET’S ADD THE THIRD DIMENSION: TIME Etc. So, if we were to track our vitality over four cycles… Etc. Second Analyses First Analyses …we would have 49 X 4 = 196 opportunities to enhance our vitality at one or more levels.
Typical Questions We Can Now Answer Using the Integrated Model • What role do trace minerals play in body composition, hydration, metabolic rate, and cellular health? • Does voltaic balancing and grounding the body • improve sleep? • How does coherent breathing influence the ability to manage stress? • What role does an integrated approach of trace minerals, stress reduction and improved diet have on overall vitality and health?
How To Use the Integrated Model of Vitality • Step 1: Identify and Define Your Goals • Weight? Energy? Stress? • Step 2: Measure Key Vital Parameters—Set Goals • Where Are You Today? • Where Do You Want to Be? • Step 3: Develop Plan to Test Variables • Daily, Weekly, Monthly • Diet? Minerals? Grounding? • Step 4: Re-test, Evaluate and Refine
A Word About the Gizmos, Graphs & Analytics
PRACTICAL APPLICATIONS OF THE INTEGRATIVE MODEL • Clinical –Health Care Centers • Nutrition/Weight Management/Fitness Programs • Stress Management Programs • Health/Nutrition/Skin/Beauty Products • Vitality-Enhancing Apparel • Workplace Wellness
Q & A About Seven Circles Model of Human Vitality
The Human Life Span (current maximum = 122 years) Infancy Youth Puberty Reproductive “Pause” “Senior” Fragile 0-1 2-12 13-17 18-40’s 50’s+ >60 122 ~ Years
The Human Life Span (current maximum = 122 years) Infancy Youth Puberty Reproductive “Pause” “Senior” Fragile 0-1 2-12 13-17 18-40’s 50’s+ >60 122 ~ Years Period of Declining Vitality for Many Fertilization/Birth: 1 Cell 100,000,000,000,000 (100 Trillion Cells) Strong Developmental & Hormonal Control Primary Biological Goal: Procreation Hormonal Decline All Cells in the Human body are replaced every 7-10 years ~1,000 cells / second Aging & Eventual Death
Some of the Signs of Declining Vitality • Loss of Body Cell Mass (Cell repair/regeneration) • Loss of Intracellular Fluids (Dehydration) • Gain of Unhealthy Body Fat (Shift in Fat/Body Cell ratio) • Loss of Energy (Total Energy and Ability to Utilize)
Some of the Signs of Declining Vitality • Loss of Mental Clarity (Memory, Focus) • Gain of Chronic Stress (+ inability to manage stress) • Sleep Problems (Duration, Cycles) • Loss of Ability to Heal • Inflammation/Auto-Immune Problems
Bio-Impedance Analysis • Safe, Non-Invasive • Reliable, Reproducible • Test Takes Minutes • Immediate Reporting • Easy to Track Trends
Many of Us Lose Total Body Water As We Age Reproductive Prime Post Menopause/Andropause During “Normal Aging” We Lose ~20% Of Our Total Body Water 60% 40%
Many of Us Lose Body Cell Mass as We Age Reproductive Prime Post Menopause/Andropause Body Cell Mass 30% 40% Loss of 10% Fat Mass 30% 20% Gain of 10% Extracellular Mass 40% 40%
Women: Body Weight Does Not Increase With Age Weak Correlation 31
Women: % Body Fat Increases With Age Strong Correlation
Women: Body Cell Mass Declines With Age Very Strong Correlation
Women: Cell Membrane Energy-”Switching” Capacity Trends Down with Age Moderate Correlation
Women: Cell Membrane Energy-Holding Capacity Declines with Age Strong Correlation
Cell Membrane Health Is a Key To Our Cellular Vitality We Can Measure This with BIA
The Vital Journey: • Developed after twelve years of research & testing • Employs the “Seven Circles” model of Vitality • Pre-and-Post Measurements + Individualized Goals & Tracking • Complementary with ongoing medical, fitness and weight management programs • Involves only natural and safety-tested approaches and products
Priorities, Goals, Resources, Plan What are your top goals to enhance your vitality? Energy? Stress? Sleep? Weight? Other? What changes would be significant? Subjective? Objective? Hours? Pounds? Percentages?
Priorities, Goals, Resources, Plan What resources are available for you to use? Testing? e-book? Products? Books? Websites? What is your plan for the project to achieve your goals?
Q & A Ernie Hubbard Erniehubbard.com 415-215-8933 erniehubbard@yahoo.com