Download
1 / 32
320 likes | 479 Vues
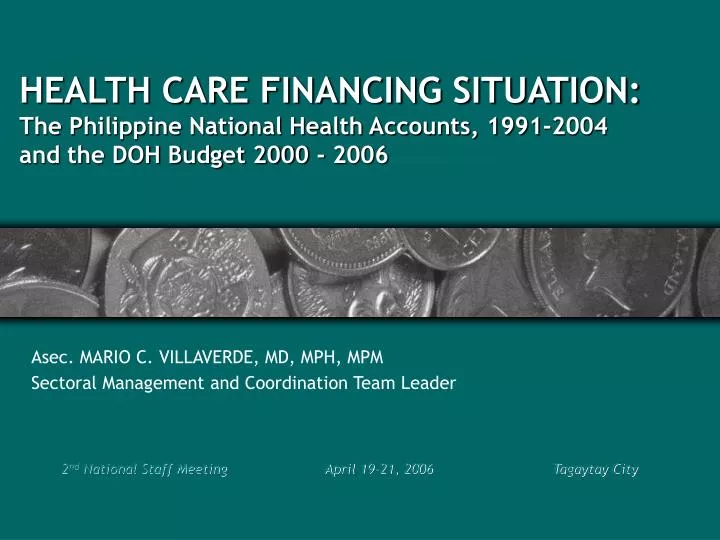
HEALTH CARE FINANCING SITUATION: The Philippine National Health Accounts, 1991-2004 and the DOH Budget 2000 - 2006. Asec. MARIO C. VILLAVERDE, MD, MPH, MPM Sectoral Management and Coordination Team Leader. Philippine National Health Accounts.

E N D
HEALTH CARE FINANCING SITUATION:The Philippine National Health Accounts, 1991-2004and the DOH Budget 2000 - 2006 Asec. MARIO C. VILLAVERDE, MD, MPH, MPM Sectoral Management and Coordination Team Leader
Philippine National Health Accounts • A framework for the compilation of information on the country’s health expenditures • Health Accounts answers . . . • who pays for health care (sources) • where health financing is being spent (uses) Sectoral Management and Coordination Team
Total Health Expenditures as a % share of GNP 2004 Total Health Expenditures = P165.2 B THE as % share of GNP 3.2% Sectoral Management and Coordination Team
Per Capita Spending for Health 2004 Sectoral Management and Coordination Team
Sources of Funds for Health 2004 Local Others 14% 12% National 16% Out-of- pocket Social Health 47% Insurance 9.5% Sectoral Management and Coordination Team
Uses of Funds for Health 2004 Others Public 11.4% 10.3% Personal 78.3% Sectoral Management and Coordination Team
Trends of Total Health Expenditures, 1991-2004 180,000 165,000 160,000 148,600 140,000 116,602 115,448 114,911 104,827 120,000 94,454 87,831 100,000 76,927 65,742 80,000 54,947 47,624 39,839 60,000 36,006 41,300 40,000 38,900 20,000 33,194 28,123 32,514 33,356 23,838 20,924 34,858 30,170 31,899 32,015 25,386 21,327 0 1991 1992 1993 1994 1995 1996 1997 1998 1999 2000 at 1985 prices at current prices (in billion pesos) 2002 2003 2004 2001 Year Sectoral Management and Coordination Team
Trends of Per Capita Health Spending, 1991-2004 Sectoral Management and Coordination Team
Share of Health Expenditures to GNP , 1991-2004 Sectoral Management and Coordination Team
Health Expenditures by Source of Funds, 1991-2004 Private Sources Government Social Insurance Sectoral Management and Coordination Team
Health Expenditures by Use of Funds, 1991-2004 Sectoral Management and Coordination Team
Sources of Government Health Expenditures, 2003 Sectoral Management and Coordination Team
Uses of Government Health Expenditures, 2004 Sectoral Management and Coordination Team
Uses of Government Health Expenditures, 2003 Sectoral Management and Coordination Team
Total Health ExpendituresNational VS Local Govt Sectoral Management and Coordination Team
DOH Health ExpendituresVS Local Govt Sectoral Management and Coordination Team
DOH Expenditures by Use of Funds Sectoral Management and Coordination Team
Local Government Health Expenditures by Use of Funds Sectoral Management and Coordination Team
Target VS Actual 2004 Health Care Spending Patterns Sectoral Management and Coordination Team
Policy Areas for Health Financing Interventions Sectoral Management and Coordination Team
Budget Appropriation CY 2000-2006, In Billion Pesos 12.00 11.42 10.74 10.00 9.98 9.91 9.73 9.56 9.46 8.00 6.00 AMOUNT IN BILLION PESOS 4.00 2.00 0.00 CY 2000 CY 2001 CY 2002 CY 2003 CY 2004 CY 2005 CY 2006 YEARS Sectoral Management and Coordination Team
Share of DOH Budget from the Total Proposed National Expenditure Program CY 2006 Auto + Unobligated DepEd 63% 11% DPWH Other 6% Agencies 7th DND 8% DILG DOH 4% DOTC SUCs 4% 1% 1% 2% Sectoral Management and Coordination Team
SUMMARY TABLE OF DOH BUDGET VS.NATIONAL GOVERNMENT BUDGET AND GROSS DOMESTIC PRODUCT(In Billion Pesos) Sectoral Management and Coordination Team
DOH & ATTACHED AGENCIES BUDGET, CY 2006 Sectoral Management and Coordination Team
CO CO MOOE MOOE (O.53B) 5% (O.53B) 5% PS PS (4.04B) 41% (4.04B) 41% (5.41B) 54% (5.41B) 54% Distribution of Budget by Expense Class CY 2006 Sectoral Management and Coordination Team
6.00 5.41 5.40 5.40 5.37 5.37 5.31 5.12 5.03 5.02 5.00 4.39 4.04 4.00 3.94 3.81 3.79 3.00 Amount In Billion Pesos 2.00 1.00 0.90 0.73 0.53 0.41 0.40 0.39 0.04 0.00 CY 2000 CY 2001 CY 2002 CY 2003 CY 2004 CY 2005 CY 2006 Years PS MOOE CO Budget Allocation By Expense Class CY 2000-2006, In Billion Pesos Sectoral Management and Coordination Team
PER CAPITA DISTRIBUTION OF MOOE* By Geographical Area, CY 2006 *CHD Offices & CHD Hospitals Sectoral Management and Coordination Team
PER CAPITA DISTRIBUTION OF MOOE* By Geographical Area, CY 2006 *NCR includes 12 MM Special Hospitals (referrals) Sectoral Management and Coordination Team
Distribution of MOOE by FunctionCY 2006 Admin. & Regulation (0.52B) 13% Hospital Public Services Health (2.46B) 61% (1.06B) 26% Sectoral Management and Coordination Team
Department of Health MOOE Distribution by FunctionCY 2000 – 2006 (In Billion Pesos) Sectoral Management and Coordination Team
Thank You! Sectoral Management and Coordination Team