Download
1 / 104
1.04k likes | 1.15k Vues
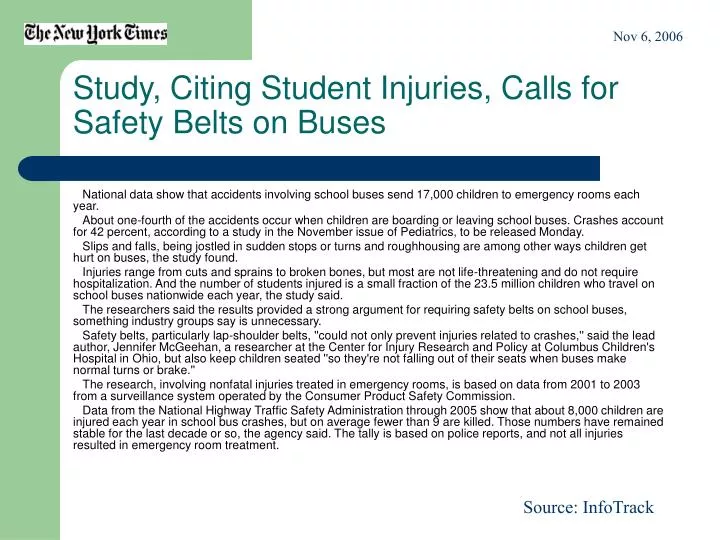
Nov 6, 2006 . Study, Citing Student Injuries, Calls for Safety Belts on Buses. National data show that accidents involving school buses send 17,000 children to emergency rooms each year.

E N D
Nov 6, 2006 Study, Citing Student Injuries, Calls for Safety Belts on Buses National data show that accidents involving school buses send 17,000 children to emergency rooms each year. About one-fourth of the accidents occur when children are boarding or leaving school buses. Crashes account for 42 percent, according to a study in the November issue of Pediatrics, to be released Monday. Slips and falls, being jostled in sudden stops or turns and roughhousing are among other ways children get hurt on buses, the study found. Injuries range from cuts and sprains to broken bones, but most are not life-threatening and do not require hospitalization. And the number of students injured is a small fraction of the 23.5 million children who travel on school buses nationwide each year, the study said. The researchers said the results provided a strong argument for requiring safety belts on school buses, something industry groups say is unnecessary. Safety belts, particularly lap-shoulder belts, ''could not only prevent injuries related to crashes,'' said the lead author, Jennifer McGeehan, a researcher at the Center for Injury Research and Policy at Columbus Children's Hospital in Ohio, but also keep children seated ''so they're not falling out of their seats when buses make normal turns or brake.'' The research, involving nonfatal injuries treated in emergency rooms, is based on data from 2001 to 2003 from a surveillance system operated by the Consumer Product Safety Commission. Data from the National Highway Traffic Safety Administration through 2005 show that about 8,000 children are injured each year in school bus crashes, but on average fewer than 9 are killed. Those numbers have remained stable for the last decade or so, the agency said. The tally is based on police reports, and not all injuries resulted in emergency room treatment. Source: InfoTrack
Jan 14, 2007 Conviction fiasco wrecks crime drive ALMOST half of the offenders caught by police are getting away without being punished by a court, according to an independent study which exposes as a sham Tony Blair's pledge to be tough on crime. In the past year 624,000 of the 1.327m offences "brought to justice" were "non-convictions" -dealt with by cautions, summary fines or official warnings, to boost the clear-up rate. The 75-page report, by the Centre for Crime and Justice Studies at King's College London, concludes there have been no "significant improvements" in law and order under Labour, and Britain remains "a high crime society". The report, published in association with The Sunday Times, assesses the boosting of spending on criminal justice by over a third in real terms over the past decade, to Pounds 22.7 billion this year. It claims Britain spends proportionately more on criminal justice than any other western country but that "there has not been a significant step change" in outcome. It dismisses Labour's manifesto claims that it has made Britain a safer place as "overstated and at times misleading". From 1998-99 to 2004-05 the police received a 21% real terms increase in funding, with even larger rises for the probation service (160%), the crown courts (116%) and the Crown Prosecution Service (44%). Yet the report shows: oCourt convictions as a proportion of offences "brought to justice" have fallen. The absolute number of convictions has also fallen. oNearly half (47%) of the 1.327m offences "brought to justice" in 2006 were "non-convictions". * Robberies have risen and murders are up by more than a third, from 600 in 1997 to 820 last year. Source: InfoTrack
individual variable Observation or case Which of these variables are categorical? Which are numerical continuous variables? Which are numerical discrete?
What is the overall pattern of the distribution? Are there any outliers? Where is the center of the distribution? How would you characterize its spread?
Go to http://amu-chemlab.avemaria.edu/~martinez/ECON303/index.htm • Use Text file: MPG • hist mpg • Use arch_firms.txt
Go to • http://amu-chemlab.avemaria.edu/~martinez/ECON303/index.htm • Use Text file: MPG • hist mpg
P:\Ave_Maria\Spring_2007\STATS\Packet\Histogram\Length_of_calls_IPS.doP:\Ave_Maria\Spring_2007\STATS\Packet\Histogram\Length_of_calls_IPS.do Length of phone calls to a customer service center
What is the likelihood that we will have at least 4 hurricanes this year?
Go to http://amu-chemlab.avemaria.edu/~martinez/ECON303/index.htm • Use Text file: MPG • summarize mpg • Use SAT_AVG.dta • summarize svavg smavg grad
Bank_worker_earnings.dta bysort worker: tabstat earnings, stat(mean)
histogram amount_spent.dta tabstat amountspent if amountspent<70, stat(mean)
growth.dta hist g, width(1) tabstat g, stat(mean median) tabstat g if g<8, stat(mean median)
SAT_AVG.dta tabstat svavg smavg grad, stat(mean min q max n)
use http://amu-chemlab.avemaria.edu/~martinez/ECON303/growth_EE.dta, clear bysort region: tabstat g, stat(min q max) gr box g, over(r)
x= 12 mean = 19.7520 x=30 deviation = -7.75 deviation = 10.25 10 15 20 25 30 35
SAT_AVG.dta tabstat svavg smavg grad, stat(mean min q max sd var n)
Using Excel, calculate Show results on the board
Standard Deviation • s measures spread around the mean and should only be used when the mean is chosen as the measure of center. • s=0 only when there is no spread. • s has the same units as the observations • Like the mean, s is notresistant: strong skewness or outliers greatly increase s.
Handedness08.dta dotplot handedness
Handedness07.dta . tabstat h, stat(min q max)