Download
1 / 19
300 likes | 752 Vues
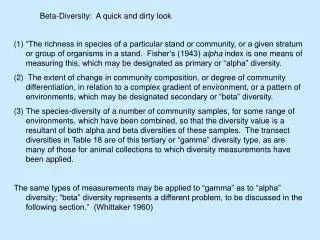
Beta-Diversity: A quick and dirty look. “The richness in species of a particular stand or community, or a given stratum or group of organisms in a stand. Fisher’s (1943) alpha index is one means of measuring this, which may be designated as primary or “alpha” diversity.

E N D
Beta-Diversity: A quick and dirty look • “The richness in species of a particular stand or community, or a given stratum or group of organisms in a stand. Fisher’s (1943) alpha index is one means of measuring this, which may be designated as primary or “alpha” diversity. • The extent of change in community composition, or degree of community differentiation, in relation to a complex gradient of environment, or a pattern of environments, which may be designated secondary or “beta” diversity. • The species-diversity of a number of community samples, for some range of environments, which have been combined, so that the diversity value is a resultant of both alpha and beta diversities of these samples. The transect diversities in Table 18 are of this tertiary or “gamma” diversity type, as are many of those for animal collections to which diversity measurements have been applied. • The same types of measurements may be applied to “gamma” as to “alpha” diversity; “beta” diversity represents a different problem, to be discussed in the following section.” (Whittaker 1960)
Whittaker (1960) NON - GRADIENT GRADIENT β=γ/α Half changes Similarity v. distance Harrison Wilson & Schmida Cowling Willig & Sandlin Blackburn & Gaston Oliver Young Pharo….. Cowling Rey Benayas Porembski Harrison Nekola & White Cody Syuzo Givnish…..
Beta divided (gradient beta) Cody (1975, 1986, 1993): β -diversity: rate of species turnover BETWEEN habitats “function mainly of difference between habitats, their areal extent, and their contiguity” γ - Diversity: rate of species turnover WITHIN a habitat type between different sites “a product fo overall speciation patterns and generally a function of site separation and of the intervening barriers to species dispersal” Nekola & White (1992, 1999, 2002) Niche difference model Environmental dissimilarity along a gradient, competitive sorting of species Model of temporal and spatial constraint Function of “spatial arrangement and histories of organisms and habitats”, explained largely by biogeographic history and dispersal capability
Fig. 1. (a) The number of studies employing different numbers of measures of beta diversity, and (b) the number of times that each beta diversity measure has been used, based on 60 publications that have employed at least one of the measures in Table 1. (Koleff & Gaston et al. 2003)
Velland (2001) Do commonly used indices of β -diversity measure species turnover? • “Conclusions: • Different measures of β -diversity reflect quite different properties of a given data set. βw and its descendants measure the inverse average frequency of species. Mean dissimilarity represents the expected difference in species composition between a randomly chosen pair of plots. • Whittaker’s half changes represent the magnitude of species turnover, and the slope of a similarity-distance graph gives the rate of species diversity per unit distance. Using the same term (β -diversity) for all these measures is not advised, because it invites comparisons among studies that in fact are not comparable. • 2. Because α and β are meant to represent components of total (γ) diversity, I feel that the term β -diversity should be reserved for a value that can be related mathematically to α and γ diversity. However, neither γ / α nor (γ - α) reflect the notion of species turnover, and the terms “β -diversity’ and ‘species turnover’ should not be used interchangeably.”
Velland (2001) Do commonly used indices of β -diversity measure species turnover? Uses for βw: “When underlying gradients are unknown, βw can be used to test the degree to which heterogeneity in species composition varies among functional groups, or among different regions for which gradients are difficult to compare. If measures of environmental characteristics cannot be explicitly matched with vegetation plots, βw could also be used to test for relationships between environmental heterogeneity and compositional heterogeneity among different regions. Simple indices of β -diversity will remain useful for asking how total species diversity is partitioned within and among plots when specific gradients are not of interest.” Uses for Species Turnover: “To address hypotheses regarding compositional change along gradients, measuring the rate and magnitude of species turnover using similarity-distance curves is appropriate and useful…. Such questions require explicit consideration of study-plot position in physical and environmental space.”
The Additive Partitioning of Diversity: γ = α + β β=γ/α γ α4 α3 β 3 β 2 α2 α1 β 1 (Wagner et al. 2003)
Advantages of Additive Partitioning (from Lande 1996, Loreau 2000, and Veech et al. 2002) “By additive partitioning, β -diversity is simply the average diversity within the complements” [all plots – pi]. Therefore, both α -diversity and β -diversity are averages, which makes it easier to compare to one another.” (Veech et al. 2002) “β-diversity as measured by additive partitioning avoids [the] gradient-related shortcomings of traditional metrics.” (Veech et al. 2002) Continuum of scales: “At each scale, diversity can then be partitioned using equation (1) [γ = α + β] such that total (or γ) diversity in a spatial unit becomes within-unit (or α) diversity at the next higher scale. The total diversity at a scale is thus determined by diversity at the next lower scale (α component) and the between-unit diversity (β component)…” (Loreau 2000) “Additive partition of diversity also suggests a natural measure of similarity among multiple communities, the proportion of the total diversity found within communities.” (Lande 1996)
“Additive partition of diversity also suggests a natural measure of similarity among multiple communities, the proportion of the total diversity found within communities.” (Lande 1996) “…a good measure of community dissimilarity is 1 – β/ γ. Defining β -diversity as the average amount of diversity not found in a sample (as we did previously) does not explicitly recognize differences among samples or communities, which after all is the original intent of β -diversity . However, sample similarity (measured by 1 – β/ γ) does directly assess sample differentiation, and it can only be derived from the additive relationship, γ = α + β.” (Veech et al. 2002)
Species shared α αave = 45 γ = 100 β = 55 ψ = 0.45 Jave = 0.29 Save = 0.44 αave = 29.25 γ = 104 β = 74.75 ψ = 0.28 Jave = 0.09 Save = 0.16 αave = 10.5 γ = 29 β = 18.5 ψ = 0.36 Jave = 0.18 Save = 0.29
Uses of Additive Partitioning (from Veech et al. 2002) • Evaluating the statistical significance of diversity components (Summerville et al. 2003) (Summerville et al. 2003) (Summerville et al. 2003)
BUT, keep in mind study design: SCALE GRAIN EXTENT
Uses of Additive Partitioning (from Veech et al. 2002) • Survey design • Nature reserve placement and design (Gering et al. 2003) (Gering et al. 2003)
Uses of Additive Partitioning (from Veech et al. 2002) • Comparative analysis of the diversity within a set of “samples” and that among samples • Relationship between local and regional species diversity Schematic illustration of the relationship between local and regional diversity and the partitioning of regional diversity into its alpha and beta components. (Gering & Crist 2002) (a–c) Scenarios where alpha is the dominant contributor (‘‘alpha-dominant’’ systems) to regional diversity. (d–f) Scenarios where beta is the dominant contributor (‘‘beta-dominant’’ systems) to regional diversity. Scale independence (a, d) will occur when alpha and beta contribute in a consistent manner to regional richness across the range of spatial scales. Constant scale dependence (b, e) will occur if alpha and beta increase in a predictable manner across the range of scales, whereas irregular scale dependence (c, f) will be evident if alpha and beta contribute to regional richness in a nonlinear manner across the range of scales. (Gering & Crist 2002)
Figure 5 Graph showing the relative contributions of alpha (solid lines) and beta (stippled lines) richness to regional richness. As in the preceding figures, the hashed line represents the points on the graph where the sum of alpha and beta diversity equal the regional diversity, whereas the light grey line represents the plane at which alpha and beta each account for half of the regional diversity. Note the switch in dominance from beta to alpha at the broadest spatial scale. (Gering & Crist 2002)
last words: Additive partitioning of diversity can be useful in analyzing components of diversity over multiple scales and a helpful addition to the suite of tools used for conservation planning. HOWEVER: it is NOT a substitute for measures of species turnover along environmental and geographic gradients NOR for a measure of similarity. While additive partitioning may give insight into the importance of the components at different scales, it says nothing about variation within the same scale. CLEAN UP THE LEXICON!! The β -diversity of γ = α + βis NOT THE SAME as the β -diversity of species turnover. The γ–diversity used by Cody, Cowling, Ferrier and a few others is not the same as the γreferred to by everyone else.
SCI Cited Reference search on Lande 1996: 84 hits SCI & BIOSIS General Search on “additive and partitio* diversity” 18 hits (6 not applicable) Gering JC, Crist TO. 2002. The Alpha-Beta-Regional Relationship: Providing New Insights Into Local-Regional Patterns of Species Richness and Scale Dependence of Diversity Components. Ecology Letters 5(3):433-44. Gering JC, Crist TO, Veech JA. 2003. Additive Partitioning of Species Diversity Across Multiple Spatial Scales: Implications for Regional Conservation of Biodiversity. Conservation Biology 17(2):488-99. Koleff P, Gaston KJ, Lennon JJ. 2003. Measuring Beta Diversity for Presence-Absence Data. Journal of Animal Ecology 72(3):367-82. Lande R. 1996. Statistics and Partitioning of Species Diversity, and Similarity Among Multiple Communities. Oikos 76(1):5-13. Loreau M. 2000. Are Communities Saturated? On the Relationship Between Alpha, Beta and Gamma Diversity. Ecology Letters 3(2):73-6. Summerville KS, Boulware MJ, Veech JA, Crist TO. 2003. Spatial Variation in Species Diversity and Composition of Forest Lepidoptera in Eastern Deciduous Forests of North America. Conservation Biology 17(4):1045-57. Veech JA, Summerville KS, Crist TO, Gering JC. 2002. The Additive Partitioning of Species Diversity: Recent Revival of an Old Idea. Oikos 99(1):3-9. Vellend M. 2001. Do Commonly Used Indices of Beta-Diversity Measure Species Turnover? Journal of Vegetation Science 12(4):545-52. Wagner HH, Wildi O, Ewald KC. 2000. Additive Partitioning of Plant Species Diversity in an Agricultural Mosaic Landscape. Landscape Ecology 15(3):219-27. Whittaker, RH. 1960. Vegetation of the Siskiyou Mountains, Oregon and California. Ecological Monographs 30(3):279-338.
![College of Business Administration [COB] Annual Report on Diversity Cathy L. Z. DuBois, Ph.D. November 10, 2004](https://cdn0.slideserve.com/2387/slide1-dt.jpg)