Download
1 / 18
180 likes | 498 Vues
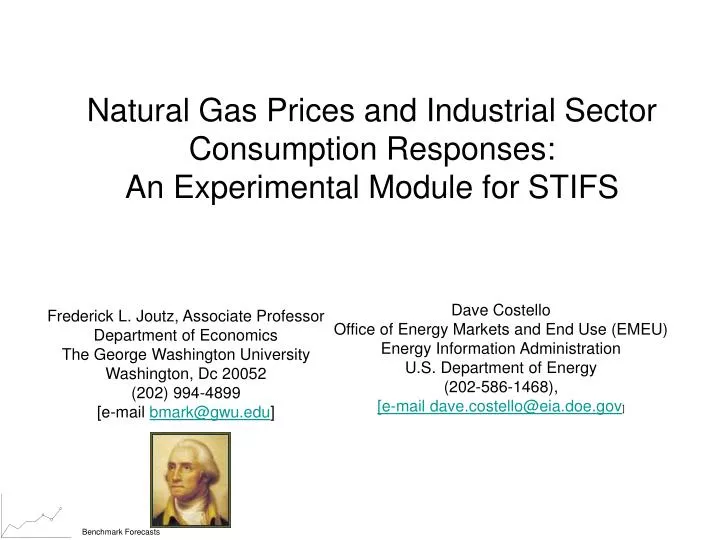
Natural Gas Prices and Industrial Sector Consumption Responses: An Experimental Module for STIFS Frederick L. Joutz, Associate Professor Department of Economics The George Washington University Washington, Dc 20052 (202) 994-4899 [e-mail bmark@gwu.edu ] Dave Costello

E N D
Natural Gas Prices and Industrial Sector Consumption Responses:An Experimental Module for STIFS Frederick L. Joutz, Associate Professor Department of Economics The George Washington University Washington, Dc 20052 (202) 994-4899 [e-mail bmark@gwu.edu] Dave Costello Office of Energy Markets and End Use (EMEU) Energy Information Administration U.S. Department of Energy (202-586-1468), [e-mail dave.costello@eia.doe.gov]
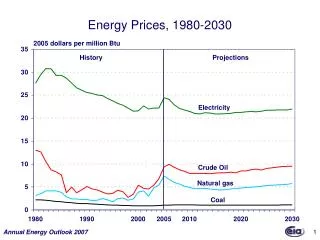
Objective • The Short-Term Integrated Forecasting System (STIFS) generates monthly forecasts of energy demand, supply and prices using some forecast information that is incorporated into STIFS that is generated by other models that do not run in an integrated framework with STIFS. • This project tests an experimental model for the interaction between natural gas prices, natural gas consumption, and industrial sector activity.
Strategy The approach taken here involves a simple VAR framework capturing the time series dynamics testing for Granger causality and examining impulse response functions and forecast error variance decompositions. In another approach (which won’t be treated in detail here), energy and economic variables are analyzed in terms of integration, cointegration for a long-run relationship between oil and natural gas prices. The general to specific modeling methodology is used to develop a data coherent parsimonious representation. Issues related to parameter constancy, encompassing, and forecasting are discussed. Ultimately, the forecasting performance of the two strategies will be compared.
Industrial Gas Demand and Gas-Intensive Industrial Output Index
The General Form of the Vector Autoregressive (VAR) system that captures the extent of feedback between the industrial sectors and (industrial) natural gas prices is: • ngicuus(p) – nominal price of natural gas to industry deflated by the producer price index for non-energy and food products, $/MCF (1982-84=0). • pgi_n(net) - Hamilton “net price” of industrial natural gas, the difference between the highest monthly price in the last three years and the current price. • nginx(c) - natural gas demand by industry including CHP, BCFD. • gbig6(y) - is the industrial production index for the six largest industrial sectors consuming 80% of that sector’s natural gas.
Econometric Model Design • Specification Tests – Alternative Models • Integration - Cointegration • Lag Length • Residual Diagnostics AIC, BC, HQ, ACFs • Normality • Granger Causality • Impulse Response • Forecast Error Variance Decomposition • Simulation • Error Correction Modeling • Further Forecast Comparisons
Table 3.a Specification Selection from Alternative VAR Models with Net Price: Sample 1989.01 – 2003.08 The five alternative models are: • No seasonal and event dummies and exogenous variables • No event dummies and exogenous variables • No exogenous variables • No event dummies • Include seasonal and event dummies and exogenous variables
Table 3.a Specification Selection from Alternative VAR Models with Net Price: Sample 1989.01 – 2003.08 • Model Reduction via F-test • MODEL(5) --> MODEL(4): F(32,444)= 1.17 [0.2382] • MODEL(5) --> MODEL(3): F(40,456)= 2.26 [0.0000]** • MODEL(5) --> MODEL(2): F(52,466)= 1.95 [0.0002]** • MODEL(5) --> MODEL(1): F(96,477)= 3.78 [0.0000]** • MODEL(4) --> MODEL(3): F(8,256) = 6.82 [0.0000]** • MODEL(4) --> MODEL(2): F(20,425)= 3.18 [0.0000]** • MODEL(4) --> MODEL(1): F(64,503)= 5.05 [0.0000]** • MODEL(3) --> MODEL(2): F(12,344)= 0.83 [0.6104] • MODEL(3) --> MODEL(1): F(56,507)= 4.45 [0.0000]** • MODEL(2) --> MODEL(1): F(44,510)= 5.48 [0.0000]** [ ] p-value
Forecast Model Simulation • How does model fit or track the turbulent period? • Crude Simulation starting January 1989. • Dynamic for endogenous variables • Actual values for exogenous variables • Fit first through sample, then only through December 1997
Summary • Tests an experimental model for the interaction between natural gas prices, natural gas consumption, and industrial sector activity. • Use a VAR framework • Incorporate a “net” natural gas price measure for memory of shocks • Impulse response function suggests industrial natural gas price shocks have a negative impact on industrial sector. • Simulation exercise suggests VAR model reasonably approximates the DGP.…
Questions for the Committee Methodology: VAR Model of Industrial Natural Gas Price, Industrial Natural Gas Consumption, Industrial Production Interactions • Does the VAR approach to modeling relationships between the variables appear fruitful? What are the strengths and weaknesses of the approach? • Should VAR models for other sectors and fuels be considered? Which ones? • Are there other “net” price variables that you think should be considered? Are their better types of shock variables? • Is modeling the natural gas consumption of the BIG 6 industrial sectors appropriate? • They are currently weighted by value-added in 2000. Are there other weighting schemes which should be considered like natural gas consumption weights?