Download
1 / 1
10 likes | 471 Vues
Temporal and Specialty Characteristics of GUH Ward Medicine Teams Sam Sawaya Department of Medicine, Georgetown University Hospital, Washington, DC Georgetown University Abstract Results

E N D
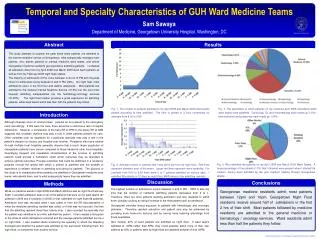
Temporal and Specialty Characteristics of GUH Ward Medicine Teams Sam Sawaya Department of Medicine, Georgetown University Hospital, Washington, DC Georgetown University Abstract Results This study attempts to quantify the peak times when patients are admitted to the internal medicine service at Georgetown, what subspecialty manages most patients, who admits patients to internal medicine ward teams, and where Georgetown medicine residents get experience admitting patients. I collected all admission data from my April 2008 and March 2009 ward team patients as well as from my February 2008 night float rotation. The majority of admissions (67%) occur between noon at 10 PM with the peak times for admissions being between 6 and 8 PM (20%). On night float, most admissions occur in the first hour and decline afterwards. Most patients are admitted to the General Internal Medicine Service (37.5%) but the next most frequent admitting subspecialties are the hematology-oncology services (31.25%). The night float rotation provides a great experience for admitting patients, while ward teams admit less than half the patients they follow. Fig. 1. The number of patients admitted to my April 2008 and March 2009 ward teams plotted according to time admitted. The time is plotted in 2 hour increments for example from 8:00 to 9:59. Fig. 3. The specialties to which patients on my medicine April 2008 and March 2009 ward teams were admitted. Cardiology, ID, and rheumatology each made up 3.13%, and endocrine and pulmonary each made up 1.04%. Introduction Although illnesses occur at random times, patients do not present to the emergency room accordingly. If this were the case, there would be a continuous rate of hospital admissions. However, a comparison of the busy ER at 5PM to the empty ER at 5AM suggests that circadian rhythms may play a role in when patients present for care. Other variables such as reputation for a particular specialty may play a role in the patient’s decision to choose one hospital over another. Residents who have rotated through multiple local hospitals generally observe that a much larger population of Georgetown patients have cancer compared to those treated at other local hospitals. Quantifying frequent and repeatable characteristics of the process of admitting patients could provide a framework under which resources may be allocated to achieve optimal outcomes. Process outcomes that could be optimized in a residency program include the speed with which a patient is admitted and the breadth of experience a resident receives in admitting and caring for patients. The purpose of this study is to characterize when patients are admitted to Georgetown medicine ward teams, who admits them, and to what subspecialty teams they are admitted. Fig. 4. Who admitted the patients on my April 2008 and March 2009 Ward Teams. A large percentage of the patients (17%) that I followed were present when I started the rotation, having been admitted by the prior resident rotating through Georgetown Wards. Fig. 2. Average number of patients that I was given per hour as night float. Red lines represent standard error of the mean. Larger red lines represent more variability. For example from 8:00 to 8:59 there were 0 to 7 patients admitted on various days. I admitted 88 patients in 12 days as night float. MAR refers to the admitting resident. Discussion Conclusions Methods The highest number of admissions occurs between 6 and 8 PM. 8PM is also the time that the number of residents admitting patients decreases from 4 to 1. Therefore, there are more patients awaiting admission and less residents to admit them, possibly causing an abrupt increase in the time patients wait for admission. Georgetown provides strong exposure to patients with hematologic and oncologic problems. Therefore resident education and patient care may be enhanced by providing more heme-onc lectures and by having more teaching attendings from these specialties. Also notably, 20% of ward patients are admitted by night float. If ward teams admitted to 10PM rather than 8PM, they could possibly admit more of their own patients as 54% of patients seen by Night float are admitted between 8 and 10PM. Georgetown medicine residents admit most patients between 12pm and 10pm. Georgetown Night Float residents receive around half of admissions in the first 2 hrs of their shift. Most patients followed by medicine residents are admitted to the general medicine or hematology / oncology services. Ward residents admit less than half the patients they follow. While on medicine wards in April 2008 and March 2009 as well as night float February 2009, I recorded admission data on all of the patients that were on my ward teams (57 patients in 2008 and 41 patients in 2009) or that I admitted on night float (88 patients). Admission time was recorded when I was called or from the ER documentation of when the medicine admitting resident was called, or if that was not recorded, the time that the admitting resident timed their history note. I also recorded the specialty that the patient was admitted to and who admitted the patient. I then created a histogram of the times at which admissions occurred and the average patients admitted per hour on night float. I also created charts examining the specialty to which the attending belonged and whether the patient was admitted by the ward team following them, the night float, or transferred from another service.