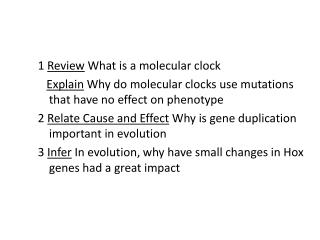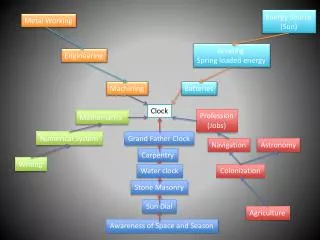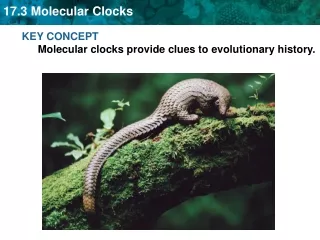
Molecular Clock I. Evolutionary rate
Molecular Clock I. Evolutionary rate. Xuhua Xia xxia@uottawa.ca http://dambe.bio.uottawa.ca. Molecular clock hypothesis. Within given gene (or DNA region), mutations (nt or aa sub) accumulate at an approximately equal rate in all evolutionary lineages. Rate constancy concept.

Molecular Clock I. Evolutionary rate
E N D
Presentation Transcript
Molecular ClockI. Evolutionary rate Xuhua Xia xxia@uottawa.ca http://dambe.bio.uottawa.ca
Molecular clock hypothesis Within given gene (or DNA region), mutations (nt or aa sub) accumulate at an approximately equal rate in all evolutionary lineages Rate constancy concept Originally based on comparisons of protein sequences for hemoglobin, cytochrome c… from different organisms Information can be used to estimate divergence times, reconstruct phylogenies… BUT… Does it hold for all genes, all genomes… ? How to reconcile with irregular rate of morphological evolution?
Clock-like substitution rate Fig. 4.15 Combined data for hemoglobins, cytochrome c & fibrinopeptide
Relative-rate test To compare rates in lineages A and B, use C as reference species If constant rate, then “distance” from outgroup to each member within group should be equal KAC = KOA + KOC (1) KBC = KOB + KOC (2) Fig. 4.16 KAB = KOA + KOB (3) KOA = (KAC + KAB - KBC ) / 2 So KOB = (KAB + KBC - KAC ) / 2 KOC = (KAC + KBC - KAB ) / 2
Relative-rate test Then according to molecular clock hypothesis: so KOA – KOB = 0 KOA = KOB and from equations (1) and (2) KOA – KOB = KAC – KBC Fig. 4.16 Can compare rates of substitution in lineages A and B directly from KAC and KBC
Rate difference A C B A C B Equal rates in lineages leading to A and B Slower rate in B lineage KAC > KBC KAC = KBC
Relative-rate test Critical assumption: KAC, KBC and KAB are estimated without error. K’AC = KOA + KOC + AC K’BC = KOB + KOC + BC K’AB = KOA + KOB + AB O A C KOA – KOB = K’AC – K’BC + AC - BC B
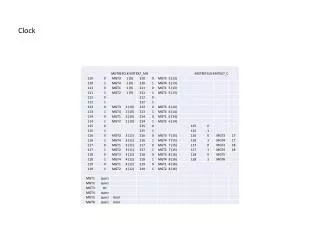
Sub. rates between rodent and human Nr = number aa positions where human vs. rat different but human vs. chicken identical Nr = 600 so replacement in rodent lineage Nh = number of aa positions where human vs. rat different but rat vs. chicken identical So replacement in human lineage Nh = 416 How do you interpret these data?
When to use AA sequence? “They used amino acid sequences instead of DNA, because the chicken and mammalian lineages diverged about 300 million years ago… … so it’d be difficult to obtain reliable estimates of divergence at synonymous sites.” p.149
Beta hemoglobin gene cluster Adult: 22(HbA) 22(HbA-2) Fatal: 21 (HbF1) 22 (HbF2) Embryonic: 22 (Hb Gower I) 22 (Hb Gower II)
Can use duplicated genes to test if rates are constant (Table 4.13) How do you interpret the data in Table 4.13 ? Cautionary note: there may be gene conversion events (“copy correction”) between sequences in multi-gene families
Causes of rate differences (p.152) • Mutation rates • Generation time • Metabolic rate (e.g., high aerobic respiration leads to mutagenic effects of oxygen free radicals) • DNA repair • Purifying selection or positive selection • Different genetic background
Sub. rate, generation time, metabolic rate Martin PNAS 1993
Rate difference between nuc and mt DNA For mammalian mitochondrial genes, Ks ~ 5.7 x 10 -8 sub/ site/ year ~ 10 x higher than for mammalian nuclear genes Mitochondrial DNA used extensively in taxonomic, forensic, conservation biology,… studies But.. in plants, mitochondrial nt sub rate very slow…
Positive selection? Tree based on growth hormone genes, with branch length proportional to the number of nucleotide substitutions Fig. 4.19
“Primitive” vs. “advanced” (p.153) Ancestor Extant organisms Fig. 4.18 Lineage which has accumulated fewer substitutions, has retained more “primitive” ancestral state But not necessarily any correlation between “primitive” appearance (morphological state) and amount of molecular change
RNA viruses and retroviruses - very rapid rate of evolution (Table 4.17) HIV retrovirus ~ 10 6 x higher than mammalian nuclear genes - error prone reverse transcription (RT) - sequences may be useful in retracing spread through population
Evolution of HIV population within an individual patient - HIV virions harvested (blue vertical lines) at various times & sequenced “Each blue tick represents a virion sampled from the patient during the course of the infection; its horizontal positionindicates when it was sampled and its vertical position indicates how genetically different it was from the first sample”. Freeman & Herron Fig. 1.10
Who brought HIV-1 to America? Gilbert, M. T. et al. The emergence of HIV/AIDS in the Americas and beyond. Proc Natl Acad Sci U S A 104, 18566-70 (2007).
Who brought HIV-1 to America? Gilbert, M. T. et al. The emergence of HIV/AIDS in the Americas and beyond. Proc Natl Acad Sci U S A 104, 18566-70 (2007).