Download
1 / 4
40 likes | 176 Vues
Engage students in calculating the percentage of energy supplied by solar panels to their school. This activity consists of three parts: 1) Collect energy usage data using a Watt’s Up meter in the school, 2) Compare estimated consumption with actual energy usage from an Excel energy bill, and 3) Calculate solar panel energy production and compare it to school consumption. Through this hands-on project, students will analyze real data, fostering an understanding of renewable energy's role and its potential limitations while identifying areas for improvement.

E N D
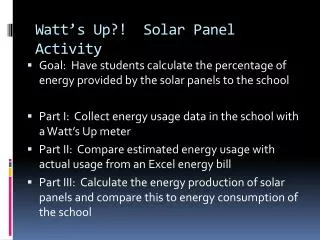
Watt’s Up?! Solar Panel Activity • Goal: Have students calculate the percentage of energy provided by the solar panels to the school • Part I: Collect energy usage data in the school with a Watt’s Up meter • Part II: Compare estimated energy usage with actual usage from an Excel energy bill • Part III: Calculate the energy production of solar panels and compare this to energy consumption of the school
Watt’s Up?... Results • Students collected data and reported a total of 242,447 kWhr of energy consumed in the month of April • Excel energy bill stated 167,038 kWhr of energy used • We WAY overestimated our energy use – after discussion we decided it was an error in how we estimated power rating for light bulbs.
Watt’s Up?... Results • Using Deck Monitor website, students were able to calculate the energy produced by solar panels in a typical day. • 1566.7 kWhr for a typical day in April • This is only 7% of our school’s energy needs!! • On a sunny day – we would be able to produce more like 10% of our energy needs.
Helpful Hints for Teachers… • Make sure to give teachers a heads up that you are coming! • Make sure to build in time during the class period to share data and do calculations – this will save you time in the long run. Use Google Docs! • Reserve a computer lab for the day you calculate energy produced from solar panels using Deck Monitoring program