Understanding Ocean Data Utilization: Importance and Measurement Techniques
This document explores the critical role of ocean data across various fields, from shipboard personnel to climate product developers. It outlines who uses this data, including ocean and atmosphere modelers, researchers, and instrument developers, and emphasizes the importance of accurate measurements in marine meteorology and oceanography. Key factors such as sensor characteristics, sampling rates, and environmental considerations are discussed, alongside essential parameters to measure like wind speed, sea temperature, and salinity.


Understanding Ocean Data Utilization: Importance and Measurement Techniques
E N D
Presentation Transcript
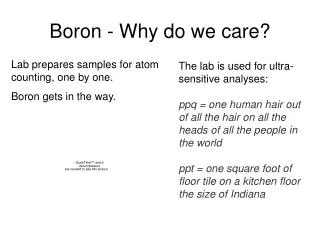
Why We Care orWhy We Go to Sea
Who Uses the Data? • Shipboard personnel • Vessel operations • Ocean deployments (buoys, CTDs, towed instruments) • Science during cruise • Secondary users (not on cruise) • Ocean and atmosphere modelers • Satellite and other remote measurement communities • Air-sea interaction researchers • Product developers (climate atlases, gridded fields) • Instrument developers
SatelliteCalibration and Algorithm Development Courtesy Darren Jackson, CIRES, NOAA/ESRL
Ocean Model Verification Ship vs. Model Ship Track over Model Salinity
Real-Time Forecast ValidationData QC http://catalog1.eol.ucar.edu/cgi-bin/dynamo/research/date_browse?dateUTC=20111109
How to Measure • Know what you want to measure . . . parameter(s). • Know the temporal and spatial scales. • Know the sensor characteristics. • Accuracy, precision, range, . . . • Know the data acquisition system. • Know the environment you will be working in.
What to Measure • Meteorology • Wind directions and speed • Air temperature • Humidity • Pressure • Rainfall • Radiation • Oceanography • Sea temperature • Salinity • Navigation • Latitude and longitude • Course over ground • Speed over ground • Speed relative to water • Heading
Sampling Rates The Nyquist-Shannon sampling theorem in general states a signal can be reconstructed from its samples if the sampling frequency is greater than twice the highest frequency of the signal (also known as the Nyquist frequency). • Oversampling is often preferred as it can • aid in anti-aliasing, • be used to increase resolution when using A/D convertors, and • help reduce uncorrelated noise when averaging multiple samples.
Accuracy/Precision Targets Manufacturer Accuracy +/- 5o +/- .3 m/s +/- .3 hPa (Analog) +/- .1 hPa (Digital) +/- .17oC (Analog) +/- .12oC (Digital) +/- 2% (0-90%) +/- 3% (90-100%) WXT sensor is even less accurate and max sample rate is 5 sec
How does the marine environment differ from the environment over land? Homogeneity Moisture source Surface friction Diurnal cycles An Introduction to Marine Meteorology
Precipitation/Clouds Radar Reflectivity 24 hr Accumulated Rain
Satellite Water Vapor 24 Oct 06Z
Temperature Air Rain Rate
Sea Temperature Local Time
Radiation SW LW