Download
1 / 25
250 likes | 275 Vues
Corotating Interaction Regions: Heliospheric Structure in 3 (and 4) Dimensions. Tuesday Afternoon SHINE 2009. In-situ Observations of CIRs on STEREO and ACE during 2007-2008 G. M. Mason, JHU/APL, Laurel, MD 20723 M. I. Desai, SWRI, San Antonio, TX

E N D
Corotating Interaction Regions: Heliospheric Structurein 3 (and 4) Dimensions Tuesday Afternoon SHINE 2009
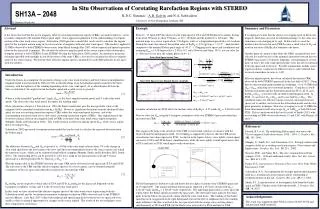
In-situ Observations of CIRs on STEREO and ACE during 2007-2008 G. M. Mason, JHU/APL, Laurel, MD 20723 M. I. Desai, SWRI, San Antonio, TX U. Mall and R. Bucik, MPS, Lindau, Germany K. Simunac, Univ. New Hampshire R. A. Leske, Caltech, Pasadena, CA SHINE Workshop 2009 Wolfville, Nova Scotia, Aug 3-7, 2009
Spectograms from -A and -B in spring 2007...quite similar plot from R. Bucik, MPS
Aug. 2008 spectograms (~5 days corotation) ... some features shifted as expected, others not seen on both S/C ? ? plot from R. Bucik, MPS Fig. 6 Spectrograms of ion energy vs. arrival time for SIT-A (upper panel) and SIT-B (lower panel) for August 2008. During this period the angular separation of the two STEREO spacecraft increased from 65.4ー to 71.2ー, or roughly five days of corotation. Double ended arrows point to nominally associated features, or associations that were observed on one spacecraft by not the other.
Stereo-B SECCHI 19.5nm image Aug 7, 2007 00:06:32 (day 220) 10 degree heliographic grid overlay as seen from STEREO-B Central meridian seen from STEREO-B is in blue; green as seen from Earth; red as seen from STEREO-A Solar Weather Browser image Stereo A is at 8.98° latitude; B at 3.78°; so the 5.2° difference is about one-half of a grid spacings. The hole at about E45 is probably the one seen by STEREO-B on day 224-26, and was probably missed by STEREO-A since it’s trace is about 5°‚ north of B, a size shown by the double headed arrow at E5 Fig. 8 SECCHI-B 19.5 nm image taken on 2008 day 220 showing the coronal hole feature giving rise to the event #32 shown in Fig. 7. Blue longitude line is central meridian (CM) seen from STEREO-B, green is CM seen from ACE, red is CM seen from STEREO-A. Double headed arrow near CM shows the approximate latitude difference between STEREO-A and -B at this time. Grid on image has 10° spacing.
Summary -- • many fast solar wind streams and CIRs observed in 2007-2008, but not all streams produced CIRs • spectral forms similar to earlier surveys; much lower intensities at ~few MeV/n compared to active period • CIRs observed sequentially from -B to -A, but not always seen; energetic particle intensity pattern did not corotate rigidly, probably due to magnetic connection effects to the CIR beyond 1 AU • for 1994-2008 the most intense CIRs were during solar active periods, but cannot pinpoint simple cause for this
How do we define a CIR? • Summary -- • many fast solar wind streams and CIRs observed in 2007-2008, but not all streams produced CIRs • spectral forms similar to earlier surveys; much lower intensities at ~few MeV/n compared to active period • CIRs observed sequentially from -B to -A, but not always seen; energetic particle intensity pattern did not corotate rigidly, probably due to magnetic connection effects to the CIR beyond 1 AU • for 1994-2008 the most intense CIRs were during solar active periods, but cannot pinpoint simple cause for this
2007-2008 period had much better defined high speed solar wind streams than prior solar minimum in 1996-1997, and many more CIRs • size distribution of CIRs shows a much sharper cutoff than 10 MeV SEP protons from GOES • about 25% of CIRs show “dropouts” for a day or so apparently when connection to acceleration region beyond 1 AU changes • some of the complex features of the CIRs appear to be due to relatively small coronal hole solar sources, wherein the different heliolatitude traces of STEREO-B, -A, and ACE played a significant role published in STEREO Science Results at Solar Minimum Mason et al. Solar Phys (2009) 256: 393-408 DOI 10.1007/s11207-009-9367-0
Comparison of CIR-associated electrons and ions on the first and third Ulysses southern high-latitude excursions D. Lario, E.C. Roelof The Johns Hopkins University. Applied Physics Laboratory (JGR, Vol. 112, A09107, doi:10.1029/2007JA012414, 2007)
No slow wind, but well correlated with CIRs observed in the ecliptic plane. Lario and Roelof [2007]
Maximum intensities at the CIR events Sayle and Simnett [1998] Lario and Roelof [2007]
Third Southern Excursion • In contrast to the long-lived and well-defined ~26-day recurrent energetic particle intensity enhancements observed throughout the first southern pass, observations at the same heliocentric distance and heliographic latitude during the third Ulysses southern pass showed a more complicated structure. • Transient events were more abundant and intense. Although CIRs are clearly present, their appearance was less regular. • Intense energetic particle events associated with well-formed CIRs bounded by FS-RS pairs were not observed until Λ>30°S (at a higher latitude than in the first orbit). Particle events in these CIRs were remarkably similar to the recurrent and regular CIR events of the 1st southern pass. • Ulysses remained immersed in the high-speed polar coronal hole solar wind flow once at Λ>39°S (36°S in the first orbit). Particle events observed during this period were also remarkably similar. • The global CIR structure, once formed, is quite similar from one solar cycle to the other.
Imaging SIR/CIR Structures with the SECCHI Imagers Angelos Vourlidas NRL
CIR Shapes in J-maps Characteristic patterns in elongation/time maps Solar wind streams From Sheeley’s Hale Lecture
So, how can we interpret the HI2 images? • What are these wave-like structures? density enhancements due to stream interaction • Why is the CIR brighter in HI2-B? B integrates along Parker spiral • Why are the shapes different? B detects streamer(?) • Where are they in the heliosphere? along Sun-Earth line A B
So, how can we interpret the HI2 images? • What are these wave-like structures? density enhancements due to stream interaction (or maybe entrained CMEs) • Why is the CIR brighter in HI2-B? HI-2B integrates along Parker spiral • Why are the shapes different? • Where are they in the heliosphere? A B • Why are the shapes different? B detects streamer(?)
Conclusions • Current status of CIR imaging w/ STEREO: • We can detect the density enhancements ahead of CIRs (or SIRs): • Crossing over the s/c • Crossing over Earth (>0.3 AU away) • Crossing over other planets • With Δn ≥ 20 e/cm3! • We can trace them in 3D space with good accuracy (~10º–20º) • We can measure their dynamics (speed, acceleration) • We can locate their formation time/distance
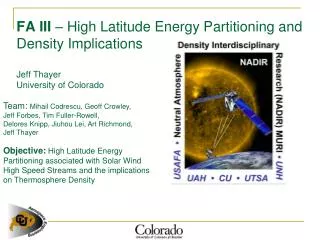
Using MHD Models to Understand CIR Structure Pete Riley, Jon Linker, Zoran Mikic, and Roberto Lionello Predictive Science, San Diego, California. SHINE WORKSHOP Wolfville, Canada Tuesday August 4th, 2009
CIR Formation in Three Dimensions Solar Maximum Declining Phase Riley et al. (2003)
Global structure of heliosphere at 2.2 AU for WSM (Aug/Sept 1996)
Global structure of heliosphere at 2.2 AU for CR 2083 (May 2009)
Basic features of CIR formation, structure, and evolution are understood: Global models can reproduce the large-scale in situ profiles Dynamics of stream interactions is understood The current solar minimum is unique in many ways: The structure of the heliosphere is more complex, in spite of many parameters being ‘weaker’ Ultimately, the solar magnetic field controls the structure we observe Summary
Some Additional Questions/Comments • Why do some CIRs produce energetic particle events at 1 AU when others do not? Can this question be addressed with models? • At what radial distance do CIRs form? In situ experiments such as Helios suggest CIRs are well established by 0.3 AU, but SECCHI observations suggest they are just forming at that distance. • We are still trying to disentangle spatial and temporal evolution of CIRs.