Download
1 / 57
570 likes | 835 Vues
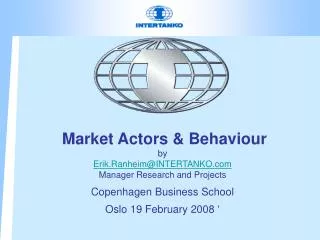
Market Actors & Behaviour by Erik.Ranheim@INTERTANKO.com Manager Research and Projects Copenhagen Business School Oslo 19 February 2008 ‘. Tanker industry. Market. Technology. Finance. Regulations. Focus on the tanker industry.

E N D
Market Actors & BehaviourbyErik.Ranheim@INTERTANKO.comManager Research and ProjectsCopenhagen Business SchoolOslo 19 February 2008‘
Tanker industry Market Technology Finance Regulations
Focus on the tanker industry Tanker industry carries one of the worlds most strategic commodities from some of the politically most tense areas in the world . Oil can potentially cause serious pollution . After many years with negative or low profitability over the last years, the tanker industry has during this decade made extremely good profit and has even received attention in the world stock markets
Tanker market Cargo Owner/ Refiner/Trader International Regulations Charterer IMO Shipbrokers Shipowner Pool/commercial man
What is IMO? International Maritime Organization • The International Maritime Organization (IMO) is the specialized agency of the United Nations (UN) concerned with Maritime Affairs located in London, England. • IMO (Formerly known as IMCO) was established under a 1948 United Nations convention that entered into force on 17 March 1958. • IMO currently has 168 member states, 2 associate members, 51 Inter-Governmental Organizations which have concluded agreements of cooperation, and 66 Non-Governmental Organizations in Consultative Status with IMO.
Why is there a need for IMO? • Shipping is international • Assets move between jurisdictions • Need for universally applied standards Without IMO trade would be restricted
What does IMO do? IMO’s main objective is tofacilitate co-operation among governments on technical and legal matters affecting international shipping Work to achieve the highest level of international standards for maritime safety, maritime security and protection of the marine environment. This is accomplished through the development of international conventions, codes, and recommendations.
IMO has adopted 55 conventions & protocols, including: • Safety of Life at Sea (SOLAS) • Prevention of pollution from Ships (MARPOL)6 Annexes • Preventing Collisions at Sea (COLREGS) • Loadlines • Standards of Training, Certification, & Watchstanding (STCW)
IMO Has Developed 25 Codes, Including: • Ship and Port Facility Security (ISPS) • Safety Management (ISM) • Standards for Training and Watchkeeping • Maritime Dangerous Goods (IMDG) • Construction and Equipment of Ships Carrying Dangerous Chemical in Bulk • Solid Bulk Cargoes • High Speed Craft • Construction and Equipment of Mobile Offshore Drilling Units
IMO has developed more than 700 recommendations & guidelines, including: • Safe access to and working in large tanks & large cargo holds • Emergency towing requirements – tankers • Medical first aid guide for use in accidents involving dangerous goods • Safe use of pesticides in ships • Packing Cargo in Freight Containers • Provisions and Display of Manoeuvring Some guidelines/recommendations are required to be followed by charterers
IMO Facts • Annual Budget 24 m • Member States fund IMO budget through assessments based largely on size of fleet(% of world’s gross tonnage) • Secretariat – 320 Staff Members 50 Nationalities
Structure of IMO Subcommittees
IMO Process Proposal by Member State Maritime Safety Committee Approval by Assembly or other Action as Appropriate Appropriate Subcommittee Working Group
Major Issues on IMO’s Agenda • Air Pollution from Ships • Role of the Human Element • Goal-based new ship construction standards • Maritime Security • Member State Assessment • Ballast Water Management • Recycling of Ships
New Approaches emerging at IMO? • Proactive vs. Reactive Goal Based Standards Maritime Security • Performance Based vs. Prescriptive Ballast Water Management
Delegations to IMO Meetings • Delegations consist of Government and/or Industry/Public Sector Advisors • Decisions on who goes are made by the Head of the Delegation to each meeting • Decisions are based upon specific issues to be discussed at each session • Individuals are recommended based on a specific area of expertise or on organizational representation • Expenses to attend IMO meetings are normally covered by the individual
IMO demographics have changed • Break up of USSR • Establishment of “Bloc” groups European Union GOLACC (Latin America) • Developing nations wanting a bigger say • Change in world’s fleet
Liberia Greece Japan Panama United Kingdom USSR Norway United States France Italy World’s Gross TonnageTop Ten – 1982
Panama (4) Liberia (1) Bahamas UK (5) Marshall Islands Singapore Greece (2) Malta China Cyprus World’s Gross TonnageTop Ten – 2007
INTERTANKO’S ROLE • As an NGO*, we represent tanker industry by: • Submitting proposals (w./without co-sponsorship) • Written comments on proposals • Verbal comments at meetings • Participating in working groups • Lobbying for support on issues • Demonstrating a proactive responsible role *None Government Organisation
Tanker market • Volatile • Dynamic, and • Open market • Congestions, storage slow steaming, imperfect information • Large number of actors • Great variety of players • Unpredictable? • Perfect market?
Development tanker ownership • Oil producers • Oil companies • Traders • Refineries • Wilh. Wilhelsen first tanker 1913 – 10 tankers by end 1st WW • Norwegian pioneers (whale oil) • Independent owners increased activity in the 1920s, mainly long term contracts • Greeks, liberty ships after 2nd WW
Seaborne trade and Middle East oil production mbd bn tonne-miles
World oil importers - 52.6 mbd - 2006 32% Mainly open markets for tankers China quickly building up tanker fleet 8.3 m dwt 4.6% of world oil tanker fleet 7% 10% 80% Japanese – long term contracts 43.2 m dwt 11.1% of world oil tanker fleet 26% 26% Open markets for tankers Source: BP, various mbd
World largest oil exporters – 30.3 mbd35% of consumption - 58% of export Pemex PdVSA KOTC Statoil NIOC/NITC Saudi Aramco/VELA Gasprom/Sovcomflot mbd
Development Shell controlled fleet No tankers Marcus Samuel built Murex at Gray’s shipyard in UK 1892
Major oil company controlled VLCCsOwned and on long term contract (1 year +) m dwt Source: J.G. Olssen Kristiansand
Major oil company controlled VLCCsOwned and on long term contract (1 year +) no VLCC 2007 Oil34% TC Chinese and Middle east companies increasing their fleets Spot45% Source: J.G. Olssen Kristiansand
Should oil companies own tankers • Vertical integration is most attractive when different types of market failure exist that threaten profitability. Bringing production in-house allows a company to internalise and thereby overcome market failures. The strategy is not without its own costs in terms of efficiency and price . • Vertical integration is best where the activity in question is complex and hard to define under conventional legal contracts. • Vertical integration is attractive when outside suppliers are few and likely to behave opportunistic, exercise market power. When economics means business, Sultan Kermally
Market value biggest oil cos $m(+ world 2nd 3rd biggest co, one tanker co) Exxon merged with Mobil, small tanker fleet Shell few tankers BP merged with Amoco – large tanker fleetTotal merged with Final/Elf, - few tankers Chevron merged with Texaco - some tankersConocoPhilips US Jones act fleet (expensive) Petrobras – large tanker fleet Statoil sold tanker company $ bn Source: FT500
Why oil companies by each other • Horizontal integration merging of firms which are at the same level of production or are involved in similar processes • Horizontal integration competitive to achieve positioning of the firm vis-a-vis rivals. • Horizontal integration to achieve economics of scale. • Horizontal integration to acquire technology and knowledge When economics means business, Sultan Kermally
20 largest spot charterers 2007– 57% of total Among the 20 biggest charterers are: - the major international oil companies (Shell, Exxon, BP) - typical tradersVitol/ Clearlake), - national oil companies (Indian Oil Co/UNIPEC/ Petrobras and- refiner Valero. Largest market share Shell has 7.5% and Shell is among the biggest charters in all segments No fixtures Source: Poten&Partners
10 largest VLCC spot charterers – 47% of total 2007 • Among the 10 biggest charterers are: • - Oil importers Sinochem, SK IOC, UNIPEC • Major international oil companies, Shell, Exxon, BP- oil exporters, CPC, VELA • Largest market share ExxonMobil has 7.1% share • No Japanese charterers • Less than half the VLCC fleet is in the spot market No fixtures Source: Poten&Partners
10 largest Suezmax spot charterers – 48% of total 2007 Largest market share ExxonMobil has 3.2% share Sun US importer No fixtures Source: Poten&Partners
10 largest Aframax spot charterers – 47% of total Largest market share Shell has 8.2% share Whereas it is the VLCC market which is highlighted, the activity in the Aframax market is 2.3 times bigger No fixtures Source: Poten&Partners
10 largest Aframax spot charterers – 47% of total Largest market share Shell has 8.2% Whereas it is the VLCC market which is highlighted, the activity in the Aframax market is 2.3 times bigger No fixtures Source: Poten&Partners
10 largest Clean spot charterers – 36% of total Largest market share the trader Vitol has 7.4% share No fixtures Source: Poten&Partners
Oil Industry stock declining Days forward demand Low stock – greater volatility – gives oil companies less bargaining power Source: IEA
VLCC freight rate/Brent Blend oil price $/per day freight rate $/per barrel oil price Strong volatility – great uncertainty Source: IEA
Cost of oil freight insignificant Gasoline prices at the pump $/gallon Dec-07 Real and nominal oil price and freight rate Volatility in the oil market more important than volatility in freight rates Oil price much more important for oil companies that freight rates Source: IEA/Various
Oil company vetting • OCIMF* question whether flag, port and Class inspection can be trusted. • OCIMF has established a comprehensive ship database – SIRE** - sharing information • Both ships and operators inspected • If these entities enforced/followed the rules effectively there would not be a SIRE ProgrammeSIRE exists to minimise as far as possible, the risk to oil companies of chartering *Oil Companies International Marine Forum host **Ship Inspection Reports Programme database for inspection reports submitted by charterers (some 1200 per year) started 1993 Source: Presentation by David Savage SIRE Director, Nov. 2007, INTERTANKO seminar
Oil company vetting • If these entities (Class, Flag/Port State) enforced/followed the rules effectively there would not be a SIRE Programme • SIRE exists to minimise as far as possible, the risk to oil companies of chartering sub-standard tankers. • Rise in Management Cos. resulted in lack of knowledge regarding operator, vessel condition and standards of operation in the 1980s • Tankers that are never inspected • under SIRE comprise what is called “The Grey Fleet (2,000 out of 8,00 tankers) Source: Presentation by David Savage SIRE Director, Nov. 2007, INTERTANKO seminar
Tanker ownership Greece, Norway, Germany; UK Japan, China, Singapore; HK Independent ownership concentrated in few nations m dwt Source: LRFairplay database
20 largest tanker owners 33 % of total more that 1000 owners 489 owners 1 tanker 146 owners 2 tankers 130 owners 10 tankers+ i.e. great fragmentation Strategies: * Shuttling oil to Japan(Mitsui/NYK) * Competing for cargoes in the open market * Bringing oil closer to the market (Saud Aramco) * Taking advantage if increased domestic import (CSG/India Gov) * Strategic alliance (Dr. Peters, OSG) * Carrying own Cargoes (BP) m dwt Source: LR/Fairplay