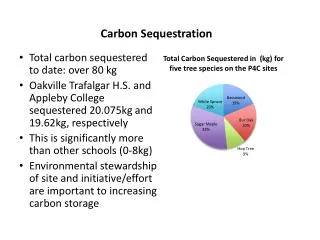
CARBON SEQUESTRATION in FORESTS
CARBON SEQUESTRATION in FORESTS . Walter E. Cartwright, RF Assistant Forest Management Division Director. Carbon The “New” Forest Product?. SEQUESTRATION. Removal or separation; banishment or exile. Withdrawal into seclusion; retirement. Confiscation or seizure. . Webster’s Definition :.

CARBON SEQUESTRATION in FORESTS
E N D
Presentation Transcript
CARBON SEQUESTRATIONinFORESTS ALABAMA FORESTRY COMMISSION Walter E. Cartwright, RFAssistant Forest Management Division Director
SEQUESTRATION • Removal or separation; banishment or exile. • Withdrawal into seclusion; retirement. • Confiscation or seizure. Webster’s Definition:
Annual Net Flux of Carbon to the Atmosphere from Land-Use Change: 1850-2000(Houghton and Hackler)
View #2 No Worry, Just Keep on Smoking – THE Fastest and Best way to Store Carbon!
View #3 The Jury is Still Out. A review of scientific journals shows there is a group of researchers who agree that the level of carbon in the atmosphere is increasing. . . But that its correlation to change in the climate is unknown.
Perception is Reality In the face of this uncertainty, society is stating its desire for action to be taken.
Why should forestry respond? • Responsibility to forest landowners • Need to maintain a productive land base • Encourage sustainable development • Encourage private lands stewardship
The Carbon Market Primer • Definition of Carbon Commodity • Methods of Carbon Sequestration • Basics of Cap and Trade • International Market • Current US Market • Regional and State Markets
The Commodity A carbon credit is equal to one metric ton of sequestered carbon. It is independent of the method used to sequester it. 1 metric ton = 1.1 US (short) ton1 US (short) ton = 2000 lbs1 Metric ton Carbon = 3.87 tons CO2
Methods of Carbon Sequestration • Terrestrial • Largely forests, minimally agriculture • Carbon cycles within system • Deep underground (Carbon capture and storage) • Oceans
Basics of Cap and Trade • Regulator sets a cap on total emissions for a group of sources. • This cap is then divided into allowances (e.g. 1 ton CO2) • Allowances are distributed (given or auctioned to members of emitter group) • Emitters measure emissions • Emitters surrender allowances to ensure they remain below cap.
Cap and Trade Success Sulfur Dioxide (SO2) in the Upper Midwest and Northeastern US. The expected market price for SO2 allowances was in the range of $579-$1,935 per ton of SO2; the actual market price as of January 2003 was $150 per ton. In the 1990s, the U.S. acid rain cap and trade program achieved 100% compliance in reducing sulfur dioxide emissions.
International Markets Kyoto Protocols • Covers 160 countries and 55% of global greenhouse gas (GHG) emissions. • 2008 to 2012 developed nations reduce GHG emissions to level 5% below 1990 emission levels • If emissions are maintained or increase countries must engage in emissions trading. • Clean energy projects, land-based projects • FORESTRY OFFSETS ARE ELIGIBLE • This is legally binding
International Markets Kyoto Protocols • Cost of compliance is prohibitive for many countries • Treaty allows for developed nations to purchase carbon credits from non-developed countries • Note that non-developed nations do not have emissions targets but can sell carbon credits
U.S. Market Chicago Climate Exchange Pilot Market Voluntary More than 200 participating organizations • This is the only legally binding market in the U.S. • Unlike Kyoto, allows offsets from N. America/developed nations • Renewable/energy efficiency • No-till agriculture • Landfill and agricultural methane • FORESTRY
U.S. Market Chicago Climate Exchange • Offsets based upon annual increase in carbon storage for enrollment period (2003-2010) • Must be under and provide evidence of sustainable management • Must have a long term commitment to project • CRP (conflicting information here) • Conservation easements (Land Legacy, Nature Conservancy, Pacific Forest Trust) • Must have the commitment to long term carbon storage as a stated goal of project
U.S. Market Chicago Climate Exchange • Very difficult for small landowner to participate due to volume. (e.g. loblolly pine plantation in SE U.S. stores 2-5 metric tons/acre/year) • Third party bundles multiple projects to sell on open market (aggregator) • Reduce transaction costs • Individual projects do not generate sufficient volume • Still requires proof of long term commitment.
U.S. Market Chicago Climate Exchange $/ton of CO2 1 Metric ton Carbon = 3.87 tons CO2
Regional and State Markets California Climate Action Registry Regional Greenhouse Gas Initiative (RGGI) Georgia Forestry Commission – Carbon Sequestration Registry
Regional and State Markets California Climate Action Registry • Nonprofit public/private partnership • Registry of voluntary GHG credits • Online reporting • Protocols for forestry • Conservation easement required • Most forest management is eligible • Requires baseline inventory (1990+) with projections. Monitoring and verification • Accepted for CCX
Regional and State Markets Regional Greenhouse Gas Initiative (RGGI or “ReGGi”) • Program will require electric power generators in participating states to reduce CO2 emissions • Already started with goal of reducing GHG emissions 10% by 2020 • Implementation of a multi-state cap-and-trade program with a market-based emissions trading system. • Afforestation is only forestry offset • Offsets located anywhere but located in RGGI have greater weight • Sale of credits provide funding for forestry incentive programs
Regional and State Markets Georgia Forestry Commission Carbon Sequestration Registry • Created by state legislation in 2004 • Registry of voluntary credits on the project level • Online reporting for documentation of carbon credits • Protocols for forestry under development • Only forestry activities are eligible (under the direction of an approved forester). Future will include urban forestry, agriculture soils, agroforestry • Requires baseline inventory (1990+) with projections. • Monitoring and verification by GFC • Accepted for CCX
Some Current Issues Currently no federal direction to establish market. Individual organizations are making voluntary commitments but methodology varies. No standardized protocols to define credits for markets. Implications to forest management and existing landowner assistance programs are unclear. Presently low value commodity market. Interest is limited.
Some Considerations for Forestry • Protocol/methodology standards • Research needs • Economic • Forest measurements • Management/Silviculture • Opportunities for existing landowner programs • Cooperation between state/federal forestry agencies • Interaction with other industry segments, including oil & gas, utility, coal, etc. • Information and education for forestry professionals and the general public
Forests and the Carbon Cycle • Carbon is constantly cycled through oceans, atmosphere, and the biosphere. • Forest and Ag. Lands are an important carbon sink • Establishing new forests and active management can increase the terrestrial carbon sink. • New markets internalize this ecosystem service • Carbon as a Commodity
Relative Carbon Storage • GA timberland offsets ~12.6 million tonnes of CO2 / yr (FIA) • Above ground biomass (excluding foliage) + coarse woody roots • Mitigation of about 8% state CO2 emissions / yr (EPD) • Nationally, U.S. forests are also a carbon sink • Offset 12% of national CO2 emissions • Globally, however, deforestation contributes 18% of human caused CO2 emissions
Guidelines for Carbon Measurement in Forests • Above ground Carbon • Below ground Carbon • Carbon in Forest Products
Estimating Carbon Stocks Protocols developed by UGA Warnell School of Forestry Provide low-cost, conservative estimates of carbon accumulation based upon sound research and accepted models. Guiding Principle: Pools Considered: Above Ground Live Biomass Below Ground Live Biomass Forest Soils Forest Products
Reporting Your Carbon Stocks Start Year Choose starting report year to begin tracking carbon. Any year 1990 or later, provided appropriate data is available. Carbon stocks will be tracked annually and compared to the starting report year to estimate carbon sequestration. When initially reported, projects will report carbon stocks for report year and provide estimates of carbon stocks for ten years into the future
Above Ground Carbon Above ground pools accepted: Main stem of live trees (bole) Merchantable height Reported by product class: Pulpwood Sawtimber Two General Methods of carbon estimation accepted: Carbon accumulation tables Direct Measurements and G/Y models
C Accumulation Tables • Carbon Tables developed for major stand types found in Georgia • Each table presents tons of carbon by age and product (pulp DBH <= 11.5” plus 15% degrade from stems with DBH > 11.5” and sawtimber DBH > 11.5” minus 15% degrade to pulp)
Many Factors Impact Growth and Yield of Timber stands: • Species/Species Mix • Site quality (site index) • Stand origin (planted cutover, planted old field, natural regeneration) • Stand density (trees/acre, basal area/acre) • Thinning condition (un-thinned, one or more thins) • Management Intensity • Level of Genetic Improvement (if planted stand)
Registered Forester Examines the Stand and Identifies • Major species • Stand origin (planted cutover site, planted ag. field, natural) • Stand age • Site quality class • Stand density (low, high) • Thinning condition (pine stands only) • Management intensity (planted pine only) • Level of genetic improvement (planted pine only)
Tables Developed for Combinations of the Following Categories: Species – Loblolly pine, Slash pine, Longleaf pine, Hardwood Origin – Planted cutover site, Planted ag field (CRP), Natural regeneration Site Index Class (base age 25 for planted stands, base age 50 for natural stands) Low, Medium, High (classes vary by species – see protocol)
Stand Density at Planting Low (<=575 trees/acre) High (> 575 trees/acre) Stand density for natural regeneration – Low and High (class limits vary by species – no density classes for hardwood stands) Thin History – Unthinned or Thinned
Management Intensity (planted stands only) • Extensive • No vegetation control via herbicides • No fertilization • Intensive • Successful woody vegetation control at site preparation • Herbaceous weed control in year of planting • Fertilization following thinning operations
Level of Genetic Improvement (planted stands only) • Unimproved (if unknown stands established < 1986) • First generation improvement (if unknown stands established between 1986 and 1999) • Second generation improvement (if unknown stands established 2000 forward)
Header record (left to right): Species = Loblolly pine Stand origin = Planted Site Index Class = High Stand Density Class = Low Management Intensity = Int (intensive) or Ext (extensive) Genetic Improvement = UI (unimproved) or 1G (1st generation) or 2G (2nd generation) Physiographic Region = LCP (lower coastal plain), PID (piedmont) or ALL (no regional differences available) Table type = CC (clearcut table – no previous thinning), T14, T15, etc.. (table for stands thinned at age 14, age 15, etc.) SampleCarbon Table
Planted Loblolly High Site Index Low Density Intensive Management Unimproved Genetics Lower Coastal Plain Clearcut table (i.e. no past thinning)
QUESTIONS? Walter E. Cartwright, RF Walter.Cartwright@forestry.alabama.gov 334.240.9331