MGS 4020 Business Intelligence Data Mining and Data Visualization Apr 16, 2013
290 likes | 480 Vues
MGS 4020 Business Intelligence Data Mining and Data Visualization Apr 16, 2013. Data Mining. Agenda. Marketing Analytics. Example. What is Data Mining?. A set of activities used to find new, hidden, or unexpected patterns in data Verification versus Discovery

MGS 4020 Business Intelligence Data Mining and Data Visualization Apr 16, 2013
E N D
Presentation Transcript
MGS 4020Business Intelligence Data Mining and Data VisualizationApr 16, 2013
Data Mining Agenda Marketing Analytics Example
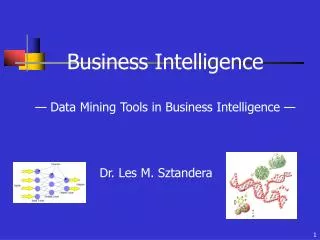
What is Data Mining? • A set of activities used to find new, hidden, or unexpected patterns in data • Verification versus Discovery • Accuracy in predicting consumer behavior
Data Warehouse / Data Mart RDBMS OLAP – Online Analytical Processing • MOLAP – Multidimensional OLAP • ROLAP – Relational OLAP
Techniques and Technologies • Techniques Used to Mine the Data • Classification • Association • Sequence • Cluster • Data Mining Technologies • Statistical Analysis • Neural Networks, Genetic Algorithms and Fuzzy Logic • Decision Trees
Market Basket Analysis • Market Basket Analysis • Most common and useful in Marketing • What products customers purchase together Diapers and Beer sell well on Thursday nights • Benefits • Better target marketing • Product positioning with stores (virtual stores) • Inventory management • Limitations • Large volume of real transactions needed • Difficult to correlate frequently purchased items with infrequently purchased items • Results of previous transactions could have been affected by other marketing promotions
Market Basket Analysis • Association Rules for Market Basket Analysis • All associations are unidirectional and take on the following form: • Left-hand side rule IMPLIES Right-hand side rule • Left and Right hand side can both contain multiple items (Multi-dimensional Market Analysis) • Examples: Steak IMPLIES Red Wine Hunting Magazines IMPLIES Smokeless Tobacco
Market Basket Analysis • 3 Measures of Market Basket Analysis • Support – the percentage of baskets in the analysis where the rule is true • Of 100 baskets 11 contained both steaks and red wine. • 11% support • Confidence – the percentage of Left-hand side items that also have right-side items • Of the 17 baskets that contained steak, 11 contained red wine. • 65% confidence • Lift – compares the likelihood of finding the right-hand item in any random basket • Also referred to as Improvement • Lift of less than 1 means it is less predictive than random choice • If Confidence is 35%, but the right-hand side items is in 40% of the baskets, the rule offers no Improvement of random selection.
Market Basket Analysis • Market Basket Analysis results can be: • Trivial • Hot Dogs IMPLIES Hot Dog Buns • TV IMPLIES TV Warranty • Inexplicable Virtual Items – Associating non-items or other attributes into the correlation study “New Customer”
Limitations of Data Mining • All relevant data items / attributes may not be collected by the operational systems • Data noise or missing values (data quality) • Large database requirements and multi-dimensionality
Data Mining Agenda Marketing Analytics Example
Why use Analytics? • Some Benefits Are Quantifiable • 15% to 51%+ increase in net sales • ROI of over 2500% • Annual increm revenue of > $178mm • For one product over a 3 yr period, $650mm in cost savings & over $350mm in increm contribution • >50% more accurate targeting of likely residential movers • 24% reduction in churn rate from modeling/targeting likely churners • Other Benefits Not So Easily Quantified • Decisions based on exhibited behaviors • Makes data actionable • Easier to measure results • Validate instincts and opinions • Enhanced what-if analysis & planning • Less guesswork, more facts • Built-in process improvement
Advanced analytics can help to answer the following questions … • How do I determine which offers to make to my customers? • What do my best customers look like, and where can I find more of them? • What is the return on my marketing investment? How might my marketing plans be tweaked to optimize investment? • Who are my most valuable customers? What are my key value drivers? • Which of my customers have the greatest potential for growth – and which have little or no potential? • Which of my customers are most vulnerable? What are the triggers causing them to leave or churn? • Where should I employ my assets to meet customer demand?
Strategy & Tactics: Guiding the business & helping to make numbers Business Planning, Forecasting, Corp Strategy, Financial Metrics, Profitability Analysis Acquisition Growth Retention Reacquisition Where can I find more revenue & profit from my current customers? Which of my customers are at risk and how can I keep them? Which customers do I want to win back? Where can I find new customers? • Propensity to buy & response modeling • Marketing Optimization • Market Basket Analysis • Online and Retail Channels • Customer and product churn modeling • Retentive stickiness of key products • Prediction of key events (eg, residential movers) • Customer Acquisition • Prospect profiling • Event driven marketing • Customer reacquisition • Customer profitability analysis Customer Knowledge – Who are my customers? Segmentation & Profiles, External Data, Mkt Share/Wallet Share, Channel Preference Modeling Marketing Analytics Landscape
General Data Mining Methods • Predicting which customers will purchase, based on demographics, psychographics, firmographics, service history, transactions, credit history, etc. Statistical algorithms and decision trees are used for these problems with much success. • Market Basket Analysis: which customers who purchase an additional telephone line are also likely to purchase dialup internet service? Pattern matching works well: associative rules, fuzzy logic, neural networks. • Which types of activities precede each other; eg, do customer hospitality and gaming activities show patterns or sequences? We use a combination of statistical modeling and simulations to identify these trigger points for action, and to estimate the marginal value of each. • Clustering is useful for determining similar groups based on how closely they resemble each other. Multitude of clustering techniques exist, with the primary difference being in how they define what is “close”. Clustering can be very useful for marketing messaging and advertising, strategy development and implementation, and channel development. Classification: Association: Sequencing: Clustering:
Analytics Process DATA KNOWLEDGE LEVERAGING POST DISCOVERY PREPARATION DEVELOPMENT ANALYTICS ANALYSIS FEEDBACK IDENTIFYING HYPOTHESIS CUSTOMER TESTING DATA WAREHOUSE OPPORTUNITIES BEHAVIOR RESULTS SCORING EXTERNAL DATA DECOMPOSITION SCOPING STATISTICAL APPEND DIRECT MAIL EFFORT MODELING TELEMARKETING OBJECTIVE DATA EXTRACTION FEEDBACK FOR SEGMENTATION EMAIL SETTING REFINING ANALYTICS LOYALTY DEVELOPING DATA VALIDATION OFFER CAMPAIGN HYPOTHESES OPTIMIZATION
Summary • Analytics allow quantifiable, intelligent decision making • Analytics can be leveraged across all areas of a business • Different analytical methods apply to different situations • Modeling enables you to combine potential hundreds of factors into a single decision metric (or a few key scores/clusters) • Analytics are more powerful when tied to bottom line profitability
Data Mining Agenda Marketing Analytics Example
InterContinental Brand Reactivation Promotion • Frequent travelers (points collectors) who had 1+ stays at InterContinental hotels in the US between Jan 1, 2001 and Jun 30, 2002. • Frequent travelers (points collectors) who had 0 stays at InterContinental hotels in the US between Jul 1, 2002 and Dec 31, 2003. • A set of activities used to find new, hidden, or unexpected patterns in data • Accuracy in predicting and reactivating these consumers behavior
SQL SELECT MBR.MEMBERSHIP_ID, MBR.FIRST_NAME, MBR.LAST_NAME, MBR.ADDR_LINE_1, MBR.ADDR_LINE_2, MBR.ADDR_LINE_3, MBR.ADDR_LINE_4, MBR.ADDR_LINE_5, MBR.CITY, MBR.STATE_DESTINATION, MBR.ZIP_CODE, MBR.TYPE, SUM (CASE WHEN EVENT.CHECK_OUT_DATE BETWEEN '01-01-2001' AND '06-30-2002' THEN 1 ELSE 0 END) AS ONE_PLUS_STAYS, SUM (CASE WHEN EVENT.CHECK_OUT_DATE BETWEEN '07-01-2002' AND '12-31-2003' THEN 1 ELSE 0 END) AS ZERO_STAYS
SQL FROM MBR, EVENT, PROPERTY, XREF WHERE ( MBR.MEMBERSHIP_ID=XREF.MEMBERSHIP_ID ) AND ( PROPERTY.PROPERTY_ID=EVENT.PROPERTY_ID ) AND ( EVENT.MEMBERSHIP_ID=XREF.MEMBERSHIP_ID ) AND ( MBR.MARKET_REGION_CODE = '05388' AND MBR.TYPE IN ('BASE','GOLD','PLTNM') AND MBR.PREF_ALLIANCE_CODE = 'POINT' AND PROPERTY.BRAND_MAJOR_CODE = ‘INTERCONTINENTAL' AND PROPERTY.MARKET_REGION = 'US' )
SQL • GROUP BY • MBR.MEMBERSHIP_ID, • MBR.FIRST_NAME, • MBR.LAST_NAME, • MBR.ADDR_LINE_1, • MBR.ADDR_LINE_2, • MBR.ADDR_LINE_3, • MBR.ADDR_LINE_4, • MBR.ADDR_LINE_5, • MBR.CITY, • MBR.STATE_DESTINATION, • MBR.ZIP_CODE, • MBR.TYPE • HAVING • ONE_PLUS_STAYS >= 1 AND • ZERO_STAYS = 0
Cluster Analysis • Definition: The identification and grouping of consumers that share similar characteristics • Yields: better understanding of prospects/customers • Translates into: improved business results through revised strategies attributes • Definition: The identification and grouping of consumers that share similar characteristics • Process: • Data Selection • Missing Values • Standardization • Removal of Outliers • Cluster Analysis Considerations
Cluster Analysis • Only want a small subset of variables for clustering • Weed out undesirable variables • Can use PROC FACTOR, PROC CORR • Can use expert system • Consideration for observations, weighting • Probably done with factor analysis • If not, then two options • Set Missing to Mean of data • Set Missing to Value of Equivalent Performance • No right or wrong answer • Might do both - depending on variables
Clustering Midscale / Business Traveler Midscale / Leisure Traveler Upscale / Business Traveler – Loan Dependent Upscale / Leisure Traveler Prospect Base Country Club / Resort Set Upscale / Business Traveler – Prosperous Traveler Other
Attribute Cluster Name A B C D E (ALL) Age of Head of Household 38 62 48 44 52 43 Length of Residence in high income group zip codes 7 12 9 6 7 7 Household Income (,000) 48 45 102 73 71 72 Weekday Check in 13 1 3 6 2 3 Weekend Check in 69 6 29 51 7 30 No. Stays (resort) between Jan 1, 2001 and Jun 30, 2002 0 5 6 5 3 2 No. Stays (mid properties) between Jan 1, 2001 and Jun 30, 2002 11 55 21 15 32 16 No. Stays (upscale properties) between Jan 1, 2001 and Jun 30, 2002 24 2 10 15 8 7 Cluster Analysis
Cluster Analysis Cluster 1 Cluster 1 Cluster 1 ------------ Calculate Scores (ROI, Response, Utilization) Overlay Profitability Estimate High RETURN Low Evaluate Risk-Return Tradeoff (by Offer and by Cluster) Low Mail RISK Make Final Selections No-Mail High DM/Offer 1 DM /Offer 2 DM /Offer N --------