Download
1 / 31
310 likes | 426 Vues
Central sulcus. departments.weber.edu/chfam/2570/Neurology.html. Magnetic forces. Superconductors -1. Permanent magnets 10 6. Deoxyg. Blood -6.52 10 -6. Water -910 -6. Air (oxygen) +0.36 10 -6. Ferromagnetic. Paramagnetic. Diamagnetic. -1. 0. Susceptibility. .

E N D
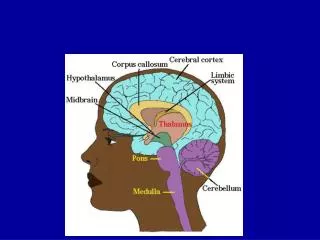
Central sulcus departments.weber.edu/chfam/2570/Neurology.html
Magnetic forces Superconductors -1 Permanent magnets 106 Deoxyg. Blood -6.52 10-6 Water -910-6 Air (oxygen) +0.36 10-6 Ferromagnetic Paramagnetic Diamagnetic -1 0 Susceptibility Negative: repelled Positive: attracted
Special dissociation curves CO stop haemoglobin giving up oxygen Fetal blood preferentially takes up oxygen in placenta
Active cortex Blood flow Blood volume Blood oxygenation Glucose and O2 Arteriole Venule Capillary Bed Glucose and O2
Lights on Lights on Lights on a 60 30 0 Bold signal b Time (s)
Heamodynamic response function Bold signal Stimulus Time (s) 8 s Initial dip Post stimulus undershoot
B C stimulus BOLD timecourses Time course of signal change at optimum TE for each field strength averaged over subjects Cycle average for each field strength. Rising edge of response intersects base-line earlier at higher field.
Squared Error Rigid body transformations parameterised by: Translations Pitch Roll Yaw Image registration (From Welcome Functional Imaging Lab)
Response to fat Correlation of BOLD response with all attributes of oral fat delivery’ Areas with a positive correlation of BOLD response with fat concentration
fMRI & Cochlear Stimulation 250 Hz, biphasic right cochlear stimulation (9V) R L Collaboration with C. Ludman (Radiology), S. Mason (Medical Physics), G. O’Donoghue (Otolaryngology)
INVERSION PULSE Possible labelling scheme • Could measure perfusion like this: Blood flow
INVERSION PULSE Magnetization transfer • Could measure perfusion like this: • The inversion pulse is off-resonance to slice • Might expect it to have no effect on slice • It does because of magnetization transfer • Exchange between bound and free protons Blood flow
CONTROL TAG INVERSION PULSE INVERSION PULSE EPISTAR Blood flow Compare TAG and CONTROL conditions TAG: tag arterial blood that will exchange with tissue CONTROL: tag venous blood
Perfusion • Brain signal comes from mixture of tissue and blood • Water assumed to be freely diffusible tracer exchanging between capillary and tissue • Exchange time assumed to be zero • Not quite true IN OUT
Blood brain partition coefficient • There are • 80.5 g water /100g blood • 84.0 g tissue /100g grey matter • Blood flowing in has more magnetization per unit volume than tissue • Blood brain partition coefficient l = water content of brain = ~ 0.98 water content of blood
Transit time • It takes the labelled blood a finite time to reach the voxel • And the even longer to reach the capillary • This must be taken account of in models Transit Time Blood flow
Kinetic model • IF Mz is equal at start of tag and control conditions is same • Then different signal is given convolution: Difference Mz Tag Control
Kinetic model Transit time Arterial input function Depends on tagging scheme Time after tag applied Transit time
Kinetic model • Residue Function • Amount of contrast remaining after a time t Input function r(t) Time
Kinetic model r(t) r(t) Time Time
Magnetization decay function • Describes T1 relaxation of tag
Labelling schemes FAIR (flow alternating inversion recovery) Blood flow • Blood in slice follows inversion recovery • Blood outside slice alternates between • following inversion recovery and • being at equilibrium (Mo)
Kidney ASL SE-EPI FAIR, 3x3x5 mm3, 96x96 matrix, TE = 23 ms Free-breathe. PW-average (40 dynamics, realigned).