Download
1 / 1
10 likes | 181 Vues
Belinda Patterson, EdD, Graduate School Chuck Rich, PhD, Institutional Planning, Research, and Assessment Christy Walcott, PhD, Psychology Justin Raines, MA, Center for Survey Research Mandee Lancaster, MA, Center for Survey Research. INTRODUCTION

E N D
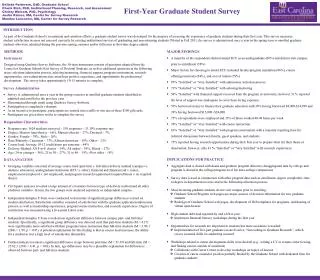
Belinda Patterson, EdD, Graduate School Chuck Rich, PhD, Institutional Planning, Research, and Assessment Christy Walcott, PhD, Psychology Justin Raines, MA, Center for Survey Research Mandee Lancaster, MA, Center for Survey Research INTRODUCTION As part of the Graduate School’s recruitment and retention efforts, a graduate student survey was developed for the purpose of assessing the experience of graduate students during their first year. This survey measures student satisfaction in areas not assessed currently by existing institutional surveys of graduating and non-returning students. Piloted in Fall 2011, the survey is administered once a year in the spring term to enrolled graduate students who were admitted during the previous spring, summer and/or fall terms as first-time degree admits. METHODS Instrument Designed using Qualtrics Survey Software, the 50-item instrument consists of questions adapted from the Council of Graduate Schools Exit Survey of Doctoral Students, as well as additional questions in the following areas: selection/admissions process, advising/mentoring, financial support, program environment, research opportunities, curriculum/instruction, most/least positive experience, and opportunities for professional development . The survey takes approximately 10-15 minutes to complete. MAJOR FINDINGS • A majority of the respondents did not attend ECU as an undergraduate (68%) and did not visit campus prior to enrollment (58%) • Major factors for choosing to attend ECU included faculty/program reputation (86%), course offerings/curricula (84%), and cost of tuition (79%) • 87% “Satisfied” or “Very Satisfied” with admissions /selection process • 71% “Satisfied” or “Very Satisfied” with advising/mentoring • 58% “Satisfied” with financial support received from the program or university; however 31 % reported the level of support was inadequate to cover basic living expenses • 59% borrowed money to finance their graduate education with 38% having borrowed $4,000-$14,999 and 39% having borrowed $15,000 -$24,000 • 75% of respondents were employed and 35% of those worked 40-49 hours per week • 74% “Satisfied” or” Very Satisfied” with course instruction • 83% “Satisfied” or “Very Satisfied” with program environment with a majority reporting time for informal discussions between faculty, guest speakers, and students • 75% reported having research opportunities during their first year to prepare them for their thesis or dissertation; however, only 41 % “Satisfied” or “Very Satisfied” with research experiences • Survey Administration • Survey is administered once a year in the spring semester to enrolled graduate students identified as admitted and enrolled in the previous year • Disseminated through email using Qualtrics Survey Software • Participation is completely voluntary • As an incentive to participate, participants are entered into a raffle to win one of three $100 gift cards. • Participants are given three weeks to complete the survey First-Year Graduate Student Survey • Respondent Characteristics • Response rate: 1624 students surveyed – 539 responses – 33.19% response rate • Degree: Masters (non-thesis) – 66%, Masters (thesis) – 27%, Doctoral – 7% • Gender: Female – 74%, Male – 26% • Race/Ethnicity: Caucasian – 77%, African American – 10%, Other – 13% • Course load: Average 10-12 credit hours per semester – 44% • Delivery Method: All F-to-F classes – 34%, All online – 39%, Mixed – 27% • Age: 24 or younger – 36%, 25 to 30 – 27%, 31 to 40 – 19%, 40 or older – 18% • IMPLICATIONS FOR PRACTICE • Aggregate data is shared with deans and graduate program directors; disaggregated data by college and program is shared at the college/program level for intra-college comparisons • Survey data is used in conjunction with other program data such as enrollment, degree completion, time to degree in department reviews and in the fellowship allocation process • Most incoming graduate students do not visit campus prior to enrolling: • Graduate School/Program web pages are major sources of decision information for new graduate students • Redesign of Graduate School web pages, development of Web templates for programs, and hosting of virtual open-houses • High student debt load reported by end of first-year: • Implement financial literacy workshops during the first year • Opportunities for research are important to students but more assistance is needed: • Implementation of five-part graduate research series, “Succeeding in Graduate Research”, which covers essential skills in conducting research • Workshops related to career development skills were desired (e.g., writing a CV or resume, interviewing, and finding careers outside of academia) • Collaborate with Career Center to develop workshops on topics of interest • Creation of career counselor position partially funded by the Graduate School with dedicated time for graduate students • DATA ANALYSIS • Grouping variables consisted of average course load (part-time v. full-time) delivery method (campus vs. distance education), undergraduate Institution (ECU v. other), financial aid (financial aid v. none), employment (employed v. not employed), and program research requirement (required thesis v. no required thesis). • Chi Square analyses revealed a large amount of covariance between type of delivery method and all other predictor variables. In turn, the two groups were analyzed separately as independent samples. • Independent-Samples T-Tests were conducted to determine if significant group differences existed on student satisfaction. Satisfaction variables consisted of satisfaction with the graduate application/admissions process, as well as mentorship experiences, program/course instruction, and research experiences. Degree of satisfaction was measured using a five-point Likert scale. • Independent-Samples T-Tests revealed one significant difference between campus part- and full-time students. Specifically, a significant group difference was detected such that part-time students (M = 4.17) were significantly more satisfied with their program/course instruction than full-time students (M = 3.90; t (284) = 1.99, p = .047). A potential explanation for this finding is that as course load increases, the ability for a student to feel a high level of satisfaction diminishes. • Further analysis revealed a significant difference in age between part-time (M = 33.39) and full-time (M = 25.62; t (294) = 8.41, p < .001). In turn, age differences may be a plausible explanation for differences observed between part- and full-time students.