Download
1 / 1

E N D
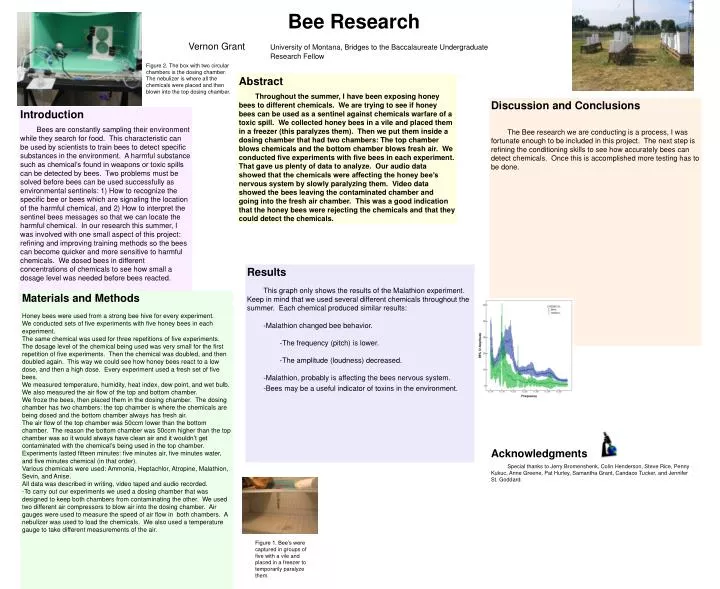
Bee Research A Picture or a Map would be a nice addition here. Delete this textbox and add a graphic. This does not need to be a figure from your paper, any eye-catching, relevant graphic will do. Give credit if the photo is not yours, and provide a short caption in small text below the photo that describes what it is. A Picture or a Map would be a nice addition here. Delete this textbox and add a graphic. Vernon Grant University of Montana, Bridges to the Baccalaureate Undergraduate Research Fellow Figure 2. The box with two circular chambers is the dosing chamber. The nebulizer is where all the chemicals were placed and then blown into the top dosing chamber. Abstract Throughout the summer, I have been exposing honey bees to different chemicals. We are trying to see if honey bees can be used as a sentinel against chemicals warfare of a toxic spill. We collected honey bees in a vile and placed them in a freezer (this paralyzes them). Then we put them inside a dosing chamber that had two chambers: The top chamber blows chemicals and the bottom chamber blows fresh air. We conducted five experiments with five bees in each experiment. That gave us plenty of data to analyze. Our audio data showed that the chemicals were affecting the honey bee’s nervous system by slowly paralyzing them. Video data showed the bees leaving the contaminated chamber and going into the fresh air chamber. This was a good indication that the honey bees were rejecting the chemicals and that they could detect the chemicals. Discussion and Conclusions The Bee research we are conducting is a process, I was fortunate enough to be included in this project. The next step is refining the conditioning skills to see how accurately bees can detect chemicals. Once this is accomplished more testing has to be done. Introduction Bees are constantly sampling their environment while they search for food. This characteristic can be used by scientists to train bees to detect specific substances in the environment. A harmful substance such as chemical’s found in weapons or toxic spills can be detected by bees. Two problems must be solved before bees can be used successfully as environmental sentinels: 1) How to recognize the specific bee or bees which are signaling the location of the harmful chemical, and 2) How to interpret the sentinel bees messages so that we can locate the harmful chemical. In our research this summer, I was involved with one small aspect of this project: refining and improving training methods so the bees can become quicker and more sensitive to harmful chemicals. We dosed bees in different concentrations of chemicals to see how small a dosage level was needed before bees reacted. • Results • This graph only shows the results of the Malathion experiment. Keep in mind that we used several different chemicals throughout the summer. Each chemical produced similar results: • -Malathion changed bee behavior. • -The frequency (pitch) is lower. • -The amplitude (loudness) decreased. • -Malathion, probably is affecting the bees nervous system. • -Bees may be a useful indicator of toxins in the environment. Materials and Methods Honey bees were used from a strong bee hive for every experiment. We conducted sets of five experiments with five honey bees in each experiment. The same chemical was used for three repetitions of five experiments. The dosage level of the chemical being used was very small for the first repetition of five experiments. Then the chemical was doubled, and then doubled again. This way we could see how honey bees react to a low dose, and then a high dose. Every experiment used a fresh set of five bees. We measured temperature, humidity, heat index, dew point, and wet bulb. We also measured the air flow of the top and bottom chamber. We froze the bees, then placed them in the dosing chamber. The dosing chamber has two chambers: the top chamber is where the chemicals are being dosed and the bottom chamber always has fresh air. The air flow of the top chamber was 50ccm lower than the bottom chamber. The reason the bottom chamber was 50ccm higher than the top chamber was so it would always have clean air and it wouldn’t get contaminated with the chemical’s being used in the top chamber. Experiments lasted fifteen minutes: five minutes air, five minutes water, and five minutes chemical (in that order). Various chemicals were used: Ammonia, Heptachlor, Atropine, Malathion, Sevin, and Anise. All data was described in writing, video taped and audio recorded. -To carry out our experiments we used a dosing chamber that was designed to keep both chambers from contaminating the other. We used two different air compressors to blow air into the dosing chamber. Air gauges were used to measure the speed of air flow in both chambers. A nebulizer was used to load the chemicals. We also used a temperature gauge to take different measurements of the air. Acknowledgments Special thanks to Jerry Bromenshenk, Colin Henderson, Steve Rice, Penny Kukuc, Anne Greene, Pat Hurley, Samantha Grant, Candace Tucker, and Jennifer St. Goddard. Figure 1. Bee’s were captured in groups of five with a vile and placed in a freezer to temporarily paralyze them. . Make your graphs big Enough so hat you’ll really be able to sAnd read them.