Download
1 / 27
270 likes | 430 Vues
David Vanzetti Australian National University. Trade-employment linkages in Indonesian agriculture. Jakarta, Indonesia, July 13th, 2010. Recent interest in trade and employment. With increased trade, countries exposed to external shocks Positive and negative GFC Food self-sufficiency

E N D
David Vanzetti Australian National University Trade-employment linkages in Indonesian agriculture Jakarta, Indonesia, July 13th, 2010
Recent interest in trade and employment • With increased trade, countries exposed to external shocks • Positive and negative • GFC • Food self-sufficiency • Does trade liberalisation costs jobs?
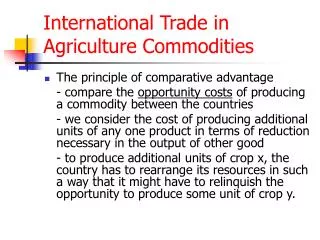
Illustrative scenario • ASEAN – China FTA • Impacts on labour market in agriculture • Use global general equilibrium model, GTAP
Trade and employment linkages • Trade and growth • +ve, causaulity? • Demand for labour intensive goods? • Capital-labour substitution • Econometric studies may be useful
Structural adjustment • Unemployment in specific sectors • Durations of unemployment • Trade policy vs labour policies? • Low labour productivity in agriculture. Better use? • Case studies may be useful
GTAP • For policy scenarios • General equilibrium trade model • Multi-region, multi-sector • Capital, labour, land, intermediate inputs • Two labour factors • Skilled • Unskilled
Assumptions • Perfect competition (e.g. agriculture) • No excess profits • Constant returns to scale • Foreign products imperfect substitutes
Demand for labour in GTAP Dlabour = f(wages, price of output, technology) Dlabour = σ (w-p) σ = elasticity of substitution Labour use decreases with wages and increases with output price. Labour use also increases with price of capital, land and other inputs
Demand for labour • Closely related to output • K/L substitution
Data for Indonesia • K/L ratios • Labour/output ratios
Capital labour ratios Low in agriculture, but dubious data
Illustrative scenario • ASEAN China FTA • Assume no exemptions • Long run closure
Labour market closures • Fixed employment • Fixed real wages • Some combination
Results • Labour use • Real wages • Real incomes
Employment and wages Change in unskilled employment and real wages under alternative labour market assumption
EmploymentPrimary agriculture Change in unskilled labour use by sector Small changes
EmploymentPrimary agriculture Absolute change in unskilled labour use by sector, Flex scenario Rice, palm oil
EmploymentProcessed agriculture Change in unskilled labour use by sector Mostly +ve with Flex
EmploymentProcessed agriculture Absolute change in unskilled labour use by sector, Flex scenario Fish, ‘other food’
Change in welfare with alternative labour market closures Greater welfare gains withflexible labour force
Implications • AFTA-CHN FTA will generate demand for labour intensive agricultural goods in IDN • Results in increased wages and/or increased employment • Fixed wages closure allows increase in labour use with large welfare implications • Some combination more realistic • Negative impact in some sectors
Limitations • Data on labour use • K/L ratios split from primary agriculture • Only two labour sectors • Not linked to household data (poverty) • Labour response data (supply elasticity)
ExtensionWith RinaOktaviani (IPB) • Combine trade impacts with single country CGE • 74 sectors (inc 30 ag) • Ten household types • Two regions (Java, non-Java) • 2005 Social Accounting Matrix
Ten households • landless rural, • rural with less 0.5 ha • with 0.5 – 1 ha, • with more than 1 ha • low income rural non-agricultural, • medium income rural non-agricultural • high income rural non-agricultural • low income urban • medium income urban • high income urban