Download

1 / 37
370 likes | 490 Vues
Improving Disaster Preparedness in an Era of Scarce Resources A View from California. R. Steven Tharratt, MD, MPVM Director, California Emergency Medical Services Authority. Disasters in California . Long history of disasters. Pioneered some aspects of response. Master Mutual Aid System

E N D
Improving Disaster Preparedness in an Era of Scarce ResourcesA View from California R. Steven Tharratt, MD, MPVM Director, California Emergency Medical Services Authority
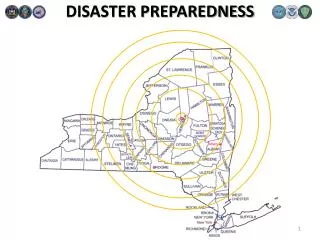
Disasters in California • Long history of disasters. • Pioneered some aspects of response. • Master Mutual Aid System • Standardized EmergencyMgmt. System • Local organization at the county level (58) • 6 mutual aid regions.
Health Disasters In California • Joint responsibility of the California Emergency Medical Services Authority (EMSA) and the California Department of Public Health (CDPH) • EMSA – 31 local EMS agencies (LEMSA’s) • CPDH – 61 Local Health Departments • Work as partners • Concept of time in disasters.
What do we mean by “Scarce Resources”? Scarce resources = austere care, crisis care, disaster care? • OR- Scarce resources = $42 billion budget shortfall in California: 2008-2010
Leverage of Existing Systems • Hospital bed status – Build “THE SYSTEM” • Locals can’t find the time to report. • Hospitals consider the data proprietary. • “Show us the money”. • How many emergencies require that level of comprehensive information in the early hours?
“Eavesdrop” on the Local Systems • All local EMS systems use one of 3 computerized status tracking systems • Most systems regional in nature. • EMSA asked for permission to access local systems in an emergency. • Requires collation of data for larger emergencies.
Response Teams: MRC’s DMAT’sWhere is the “sweet spot”? • Cal-MAT’s • Based on DMAT program. • Used within California for fire response. • California’s mobile field hospitals. • 3 – 222 bed capability. • Cal-MAT “opens” the personnel component. • Augmented with DMAT / MRC members. • Leverages “Disaster junkies” who want a defined regional response.
A View From Missouri Nancie McAnaugh Deputy Department Director Missouri Department of Health and Senior Services
Health Disasters in Missouri • Lead responsibility rests with the Missouri Department of Health and Senior Services in conjunction with state and local partners • 114 Autonomous Local Public Health Agencies • 171 Public Safety Answering Points • 215 Licensed Ground Ambulance Services
Regionalization Activities • Regionally located assets • Regional Ethics Committees • Regional LPHA Contracts
Regionalization Activities • Regional response plan for BioWatch • Regional Planning for Scarce Resource Allocation • Regional Homeland Security Advisory Councils
Public Private Partnerships • Scarce Resource Allocation Committee • Ready in 3 Materials • Missouri Hospital Association • Missouri Funeral Director’s Association • MOP3 • Faith-Based Initiative
Exercising More While Spending Less Paul D. Biddinger, MD FACEP Harvard School of Public Health Center for Public Health Preparedness Massachusetts General Hospital
Exercise Design • The quality of an exercise dramatically affects: • The experience of the participants • Affects motivation for future exercises • Affects training of participants • The ability to learn useful lessons
Exercise Design • Quality can be significantly improved with: • Early focus on objectives • Early focus on evaluation • Broad and appropriate representation • Use (and nurturing of) of available expertise
Setting Objectives • Begin your exercise planning with a limited number of specific, measurable objectives • Set priorities • Be realistic • Avoid “objective creep”
Focus on Evaluation • Evaluation of exercises is often an afterthought • Exercises need to be designed so you know whether/how you met your objectives • Need: • Evaluation materials • Evaluators
Encourage Broad Representation • Horizontal and vertical participation is essential • Need appropriate level of representatives at the table • Competing exercise programs mean you have to spend time to get time
Many resources are available for exercise design and evaluation: LLIS HSEEP Toolkit Design and development system BTCreate (NACCHO) HSPH-CPHP toolkit Columbia Exercise Toolkit AHRQ hospital exercise toolkit Local emergency response partners Local academics Your own staff Use Available Expertise
Pitfalls • Heavy reliance on outside resources • Irrationally setting objectives / letting others set your objectives for you • Failing to include/participate with other partners • Not making exercises a routine part of the preparedness process • Not fixing the problems you find
A Game of NumbersThe Preparedness Balance Sheet MauriceA.Ramirez,DO,PhD,BCDM,BCEM Founder/President High Alert, LLC Founding Chairperson American Board of Disaster Medicine
A Game of Numbers How Will This Effect the Balance Sheet?
Costs Equipment Staff Training Salaries for Training Resource Stockpiles Externally Validated Drills and Exercises Extra Personnel Dollars and Sense $1400/Licensed Bed $3920/Licensed Bed/yr. $1780/Licensed Bed/yr. $1400/Licensed Bed $530/Licensed Bed/drill(2 per year) $1350/Licensed Bed/day Total Cost = $10400/bed/yr Preparedness Balance SheetEvent Response Model
Dollars and Sense $0.00 $0.00 Priceless Total Revenue = $0.00 Benefits Joint Commission NIMS Compliance Legal Protection Qui Tam Sarbanes Oxley Preparedness Balance SheetEvent Response Model
Costs Equipment Staff Training Salaries for Training Resource Stockpiles Externally Validated Drills and Exercises Response Personnel NET LOSS = $10400/bed/yr Benefits Joint Commission NIMS Compliance Legal Protection Qui Tam Sarbanes Oxley Preparedness Balance SheetEvent Response Model
Costs Equipment Staff Training Salaries for Training Resource Stockpiles Externally Validated Drills and Exercises Extra Personnel Dollars and Sense $1400/Licensed Bed $4920/Licensed Bed/yr. $1800/Licensed Bed/yr. $1400/Licensed Bed $530/Licensed Bed/drill(1 per year) $1350/Licensed Bed/day Total Cost = $11500/bed/yr Preparedness Balance SheetProcess Enhancement Model
Business Benefits Joint Commission NIMS Compliance Legal Protection Qui Tam Sarbanes Oxley Improved Customer Satisfaction Fewer AMA/LWOT Increased Admits Dollars and Sense $0.00 $0.00 Priceless Priceless One Admission per Bed/yr $17374/Licensed Bed/yr Total Revenue = $17374/Bed/yr Preparedness Balance SheetProcess Enhancement Model
Costs Equipment Staff Training Salaries for Training Resource Stockpiles Externally Validated Drills and Exercises Extra Personnel Business Benefits Joint Commission NIMS Compliance Legal Protection Qui Tam Sarbanes Oxley Improved Customer Satisfaction Fewer AMA/LWOT Increased Admits Targeted Response reduces cost of response NET PROFIT = $5874/Bed/yr Preparedness Balance SheetProcess Enhancement Model
Process Enhancement Process Analysis Business Processes Healthcare Processes Income Streams Daily Needs/Resources Inventory Benchmark Triggered Targeted Process Enhancement Event Response Vulnerability Analysis Hazard Based Kaiser Model Income Insensitive Centered on Recognized Events Event Triggered Untargeted Response and Expenditure Preparedness Balance Sheet
Process Enhancement Process Analysis Business Processes Healthcare Processes Income Streams Daily Needs/Resources Inventory Benchmark Triggered Targeted Process Enhancement Net Profit: $5874/Bed/yr Event Response Vulnerability Analysis Hazard Based Kaiser Model Income Insensitive Centered on Recognized Events Event Triggered Untargeted Response and Expenditure Net Loss: $10400/Bed/yr Preparedness Balance Sheet
Preparedness Balance Sheet • The Return on Investment (ROI) $16274/Licensed Beds/yr $5874/Licensed Bed/yr Profit Improved Customer Satisfaction Fewer AMA’s/LWOT’s More Admissions Shorter Response Phase Quicker Return to Full Operations Greater Surge Capacity
Preparedness Balance Sheet • Healthcare planning traditionally based on “same day last year” and “last time this happened” parameters. • Healthcare disaster planning too often looks to change operational procedures. • “Practice the way you will play”- Vince Lombardi • “Play the Way You Will Play!”- Maurice A. Ramirez