Interpreting regression for non-statisticians
290 likes | 421 Vues
Interpreting regression for non-statisticians. Colin Fischbacher. What this presentation will cover. overview of regression methods what are they and why use them? what do results from regression look like? how do you interpret those results? what pitfalls should I look out for?.

Interpreting regression for non-statisticians
E N D
Presentation Transcript
Interpreting regression for non-statisticians Colin Fischbacher
What this presentation will cover • overview of regression methods • what are they and why use them? • what do results from regression look like? • how do you interpret those results? • what pitfalls should I look out for?
What is regression? • regression relates two kinds of variables: • outcome variables: for example • 30 day mortality • Blood pressure • CHD admission rate • explanatory variables: for example • age • sex • treatment type
What is regression? (2) are these variables related? if so, in what way?
What is regression? (3) the red line is an estimate of the relationship that best fits the data we have other estimates are possible
What is regression? (3) the red line is an estimate of the relationship that best fits the data we have other estimates are possible
What is regression? (4) regression can examine more than one explanatory variable at a time males in red, females in black . . . females have higher blood pressure overall
What is regression? (5) males in red, females in black . . at each age male blood pressure is higher
What is regression? (6) • here regression is used to estimate how much blood pressure rises with age (so many mm/yr) • taking this effect of age into account, regression is used to estimate how much higher male blood pressure is than female blood pressure (so many mm higher, taking into account age) males in red, females in black
Why use regression methods? • There are other methods to adjust for one or two variables • standardisation • stratification • These methods deal well with one or two explanatory variables (usually age or sex) • Regression allows you to take into account the effect of many variables at the same time • Answers the question “What’s the effect of this variable allowing for all the other ones in the model?”
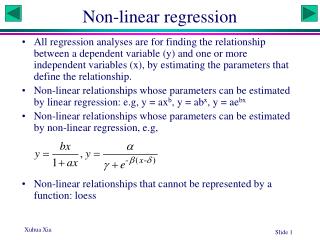
What methods are available? • Depends on outcome variable . . • Continuous variable (eg blood pressure) • linear regression • Yes/no/binary outcome (eg dead/alive) • logistic regression • Rate variable (eg admissions per year) • Poisson regression • Time to event (eg death from cancer) • Cox regression/ survival analysis • (Many other types also available)
Linear regressionContinuous outcome data (eg blood pressure)
Some notes of caution • Regression is technically easy with most stats packages (point and click) • However skill is needed: • to choose the right method and the best model • to select how many and which variables to include • to check that the final model fits well • to interpret the final results • There are always important assumptions • Modelling requires experience and judgement and includes a degree of subjectivity
What should I look for? • The kind of model used (logistic, Poisson etc) • The variables included in the model • The effect estimates for each variable (or “parameter”) • For each categorical variable an indication of which category is the reference category (usually given a null effect size) • An assessment of the goodness of model fit
What do the results mean? Effect estimates (may be called coefficients) may be: • Single figures • Odds ratios • Rate ratios • Hazard ratios
Linear regressionContinuous outcome data (eg blood pressure)
What else should I look for? • Is the basic question clear? • why was a regression method chosen? • Was the correct model used? • logistic if yes/no outcomes, Poisson if rates etc • Which variables were included? • Were any ones you think are important left out? • How were the variables chosen? • modelling strategies and results of exploration? • How many variables were included? • 10 -20 cases per variable approximate rule of thumb • Effect sizes (or “coefficients”) and confidence intervals • Were measures of model fit reported?
regression methods real life examples
Cox regression McBride and colleagues (BMJ Dec 4, 2010) conducted a study of patients in 324 UK general practices and examined the time they waited between consulting their GP with hip pain and being referred to secondary care. The figures show hazard ratios for referral from a Cox regression model that included age group, sex and deprivation quintile
Poisson regression Sim and colleagues (BMJ Dec 4, 2010) conducted a study to examine changes in the rate of emergency admission for acute myocardial infarction before and after the introduction of smoke free legislation in England. After adjusting for year of admission, temperature, Christmas holidays and week of admission in a Poisson regression model, they obtained the results shown in the table. BMJ 340: doi:10.1136/bmj.c2161
Logistic regression Alm and colleagues interviewed parents of 294 cases of Sudden Infant Death Syndrome (SIDS) in three Scandinavian countries, asking about coffee and alcohol consumption by the mother. * adjusted for maternal smoking in 1st trimester, maternal age, education and parity Arch Dis Child 1999;81:107-111 doi:10.1136/adc.81.2.107
Conclusions Regression methods allow you to examine the effects of many variables simultaneously However they do not give “automatic” answers Care is needed in choice of method, selection of variables, testing the final model and interpreting the results Model building always involves some degree of judgement and personal choice