Download
1 / 24
240 likes | 393 Vues
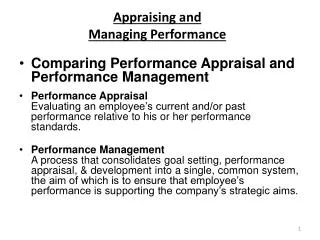
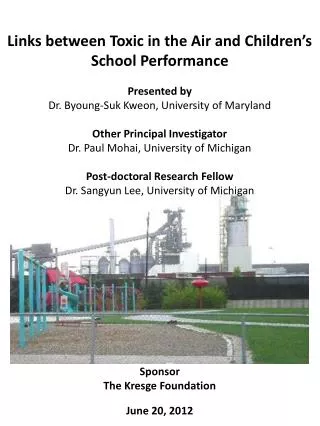
Links between Toxic in the Air and Children’s School Performance. Presented by Dr. Byoung-Suk Kweon, University of Maryland Other Principal Investigator Dr. Paul Mohai, University of Michigan Post-doctoral Research Fellow Dr. Sangyun Lee, University of Michigan. Sponsor

E N D
Links between Toxic in the Air and Children’s School Performance Presented by Dr. Byoung-Suk Kweon, University of Maryland Other Principal Investigator Dr. Paul Mohai, University of Michigan Post-doctoral Research Fellow Dr. SangyunLee, University of Michigan Sponsor The KresgeFoundation June 20, 2012
Article in Health Affairs examining air pollution burdens from industrial sources around schools available at: (http://content.healthaffairs.org/content/30/5.toc)
Total toxic concentration contours in the state of Michigan (2006 RSEI) Contours based on accumulated area of 1 km by 1 km grid cells in ascending order of total toxic concentration from 2006 Risk Screening Environmental Indicator
Total toxic concentration contours in the state of Michigan (2006 RSEI and Top 10 Percentile) Contours based on accumulated area of 1 km by 1 km grid cells in ascending order of total toxic concentration from 2006 Risk Screening Environmental Indicator
Estimating toxic air concentrations from industrial sources within 2 km of schools using areal apportionment Mean air toxic concentration within 2 km circle of the school = ∑ %CGi * TCi %CGi = Percent of area of the 2 km circle captured by grid celli TCi = Total toxic concentration in grid celli n i=1
Top 12 chemicals in areas within 2 km of schools Data obtained from Scorecard: http://www.scorecard.org.
Changes in median air toxic concentrations, 1999-2006 Schools (Metro) = areas within 2 km of schools in Detroit Metro Area Schools (DET) = areas within 2 km of schools in Detroit
Deciles of total toxic concentration in Michigan and school-based demographics Total toxic concentration estimates are based on 2006 Risk Screening Environmental Indicator (RSEI) data.
Schools whose toxic concentration (TC) are greater than their districts’ Total toxic concentrations based on 2006 RSEI-GM and are within 2 km of schools.
Percent of students not meeting MEAP standards for English by percentiles of total toxic concentration MEAP scores are for 2007. Pollution estimates come from 2006 RSEI. Percent of students not meeting MEAP standards are based on averages across all schools in Michigan.
Percent of students not meeting MEAP standards for math by percentiles of total toxic concentration MEAP scores are for 2007. Pollution estimates come from 2006 RSEI. Percent of students not meeting MEAP standards are based on averages across all schools in Michigan.
Regression analysis of percent of students not meeting 2007 MEAP standards by total toxic concentration from 2006 RSEI * P < .05; ** p < .01; *** p < .001
Respiratory risk contours in the state of Michigan (2005 National Air Toxics Assessment) Contours based on accumulated area (in square kilometers) of census tracts in ascending order of respiratory risk estimates from 2005 NATA
Respiratory risk contours in the state of Michigan (2005 NATA and Top 10 Percentile) Contours based on accumulated area (in square kilometers) of census tracts in ascending order of respiratory risk estimates from 2005 NATA
Estimating cancer risk within 2 km of schools using areal apportionment Mean cancer risk within 2 km circle of the school = ∑ %CTi * CRi %CTi = Percent of the area of the circle captured by the tracti CRi= Cancer risk for the tracti n i=1
Deciles of respiratory risk in Michigan and school-based demographics Respiratory risk estimates are based on 2005 NATA and include major, area, on-road mobile, non-road mobile, and background sources
Percentage of schools whose respiratory risk ratios are greater than their districts’ Respiratory risk ratio is based on 2002 NATA and includes major, area, on-road mobile, non-road mobile, and background sources
Percent of students not meeting MEAP standards for English by percentiles of total respiratory risk MEAP scores are for 2007. Pollution estimates come from 2005 NATA. Percent of students not meeting MEAP standards are based on averages across all schools in Michigan.
Percent of students not meeting MEAP standards for math by percentiles of total respiratory risk MEAP scores are for 2007. Pollution estimates come from 2005 NATA. Percent of students not meeting MEAP standards are based on averages across all schools in Michigan.
Regression analysis of percent of students not meeting 2007 MEAP standards by total respiratory risk from 2005 NATA * P < .05; ** p < .01; *** p < .001
Michigan school siting factors Norton, 2008
Policy implications • Ensure cooperation among federal, state and local agencies • Analyze potential school sites • Require minimum distances between schools and environmental hazards • Adopt environmental mitigation policies