Global Carbon Budget
600 likes | 620 Vues
Explore the latest global carbon budget, including data, sources, and trends in carbon emissions. Presented by top experts and supported by leading institutions. Contact for more info.

Global Carbon Budget
E N D
Presentation Transcript
Global Carbon Budget Published on 13 November 2017 2017 PowerPoint version 1.1 (released 15 January 2018)
The work presented here has been possible thanks to the enormous observational and modelling efforts of the institutions and networks below Acknowledgements Atmospheric CO2 datasets NOAA/ESRL (Dlugokencky and Tans 2017) Scripps (Keeling et al. 1976) Fossil Fuels and Industry CDIAC (Boden et al. 2017) USGS, 2017 UNFCCC, 2017 BP, 2017 Consumption Emissions Peters et al. 2011 GTAP (Narayanan et al. 2015) Land-Use Change Houghton and Nassikas 2017 Hansis et al. 2015 GFED4 (van der Werf et al. 2017) FAO-FRA and FAOSTAT HYDE (Klein Goldewijk et al. 2017) LUH2 (Hurtt et al. 2011) Atmospheric inversions CarbonTracker Europe (van der Laan-Luijkx et al. 2017) Jena CarboScope (Rödenbeck et al. 2003) CAMS (Chevallier et al. 2005) Land models CABLE | CLASS-CTEM | CLM4.5(BGC) | DLEM | ISAM | JSBACH | JULES | LPJ-GUESS | LPJ | LPX-Bern | OCN | ORCHIDEE | ORCHIDEE-MICT | SDGVM | VISIT CRU (Harris et al. 2014) Ocean models CCSM-BEC | CSIRO | MITgem-REcoM2 | MPIOM-HAMOCC | MICOM-HAMOCC | NEMO-PISCES (CNRM) | NEMO-PISCES(IPSL)| NEMO-PlankTOM5 | NorESM-OC pCO2-based ocean flux products Jena CarboScope (Rödenbeck et al. 2014) Landschützer et al. 2016 SOCATv5 (Bakker et al. 2016) Full references provided in Le Quéré et al 2017
Contributors 77 people | 57 organisations | 15 countries C Le Quéré UK| RM Andrew Norway| GP Peters Norway | JG Canadell Australia| P FriedlingsteinUK | R Jackson USA | S SitchUK| JI Korsbakken Norway| J PongratzGermany | AC Manning UK Thomas A. Boden USA | Pieter P. Tans USA | Oliver D. Andrews UK | Vivek K. Arora Canada | Dorothee C. E. Bakker UK | Leticia Barbero USA | Meike Becker Norway | Richard A. Betts UK | Laurent Bopp France | FrédéricChevallier France | Louise P. Chini USA | Philippe Ciais France | Catherine E. Cosca USA | Jessica Cross USA | Kim Currie New Zealand | Thomas Gasser Austria | Ian Harris UK | Judith Hauck Germany | Vanessa Haverd Australia | Richard A. Houghton USA | Christopher W. Hunt USA | George Hurtt USA | Tatiana Ilyina Germany | Atul K. Jain USA | Etsushi Kato Japan | Markus Kautz Germany | Ralph F. Keeling USA | Kees Klein Goldewijk The Netherlands | Arne Körtzinger Germany | Peter Landschützer Germany | Nathalie Lefèvre France | Andrew Lenton Australia | Sebastian Lienert Switzerland | Ivan Lima USA | Danica Lombardozzi USA | Galen McKinley USA |Nicolas Metzl France | Frank Millero USA | Pedro M. S. Monteiro South Africa | David R. Munro USA | Julia E. M. S. Nabel Germany | Shin-ichiroNakaoka Japan | Yukihiro Nojiri Japan | X. Antonio Padín Spain | Anna Peregon France | Benjamin Pfeil Norway | Denis Pierrot USA | Benjamin Poulter USA | GregorRehder Germany | Janet Reimer USA | Christian Rödenbeck Germany | Joyashree Roy India | Jörg Schwinger Norway | Roland Séférian France | IngunnSkjelvan Norway | Benjamin D. Stocker Spain | Hanqin Tian USA | Bronte Tilbrook Australia | Ingrid T. van der Laan-Luijkx The Netherlands | Guido R. van der Werf The Netherlands | Libo Wu China | Steven van Heuven The Netherlands | Nicolas Viovy France | Nicolas Vuichard France | Anthony P. Walker USA | Andrew J. Watson UK | Andrew J. Wiltshire UK | SönkeZaehle Germany | Dan Zhu France Atlas Team Members at LSCE, France P Ciais| A Peregon | P Peylin| P Brockmann | V Maigné | P Evano | C Nangini Communications Team O Gaffney | A Minns | A Scrutton
Publications https://doi.org/10.5194/essdd-2017-123 https://doi.org/10.1038/s41558-017-0013-9 https://doi.org/10.1088/1748-9326/aa9662
Data Access and Additional Resources GCP Website Global Carbon Atlas More information, data sources and data files: http://www.globalcarbonproject.org/carbonbudget Contact: c.lequere@uea.ac.uk More information, data sources and data files: www.globalcarbonatlas.org (co-funded in part by BNP Paribas Foundation) Contact: philippe.ciais@lsce.ipsl.fr
All the data is shown in billion tonnes CO2 (GtCO2) 1 Gigatonne (Gt) = 1 billion tonnes = 1×10¹⁵g = 1 Petagram (Pg) 1 kg carbon (C) = 3.664 kg carbon dioxide (CO2) 1 GtC = 3.664 billion tonnes CO2 = 3.664 GtCO2 (Figures in units of GtC and GtCO2 are available from http://globalcarbonbudget.org/carbonbudget) Most figures in this presentation are available for download as PDF or PNGfrom tinyurl.com/GCB17figs along with the data required to produce them. Disclaimer The Global Carbon Budget and the information presented here are intended for those interested in learning about the carbon cycle, and how human activities are changing it. The information contained herein is provided as a public service, with the understanding that the Global Carbon Project team make no warranties, either expressed or implied, concerning the accuracy, completeness, reliability, or suitability of the information.
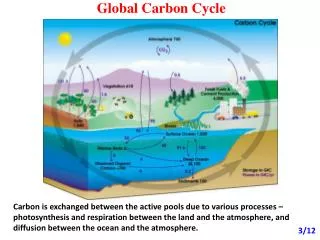
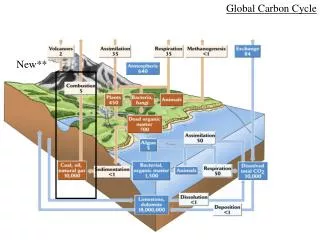
Anthropogenic perturbation of the global carbon cycle Perturbation of the global carbon cycle caused by anthropogenic activities,averaged globally for the decade 2007–2016 (GtCO2/yr) The budget imbalance is the difference between the estimated emissions and sinks. Source: CDIAC; NOAA-ESRL; Le Quéré et al 2017;Global Carbon Budget 2017
Emissions from fossil fuel use and industry Global emissions from fossil fuel and industry: 36.2 ± 2 GtCO2 in 2016, 62% over 1990 Projection for 2017: 36.8 ± 2 GtCO2, 2.0% higher than 2016 Estimates for 2015 and 2016 are preliminary. Growth rate is adjusted for the leap year in 2016.Source: CDIAC;Le Quéré et al 2017;Global Carbon Budget 2017 Uncertainty is ±5% for one standard deviation (IPCC “likely” range)
Top emitters: fossil fuels and industry (absolute) The top four emitters in 2016 covered 59% of global emissionsChina (28%), United States (15%), EU28 (10%), India (7%) Bunker fuels are used for international transport is 3.1% of global emissions.Statistical differences between the global estimates and sum of national totals are 0.6% of global emissions.Source: CDIAC; Le Quéré et al 2017;Global Carbon Budget 2017
Emissions Projections for 2017 Global emissions from fossil fuels and industry are projected to rise by 2.0% in 2017The global projection has a large uncertainty, ranging from +0.8% to +3.0% Source: CDIAC; Jackson et al 2017; Le Quéré et al 2017; Global Carbon Budget 2017
Top emitters: fossil fuels and industry (per capita) Countries have a broad range of per capita emissions reflecting their national circumstances Source: CDIAC; Le Quéré et al 2017;Global Carbon Budget 2017
Top emitters: fossil fuels and industry (per dollar) Emissions per unit economic output (emissions intensities) generally decline over timeChina’s intensity is declining rapidly, but is still much higher than the world average GDP is measured in purchasing power parity (PPP) terms in 2010 US dollars. Source: CDIAC; IEA 2016 GDP to 2014, IMF 2017 growth rates to 2016; Le Quéré et al 2017;Global Carbon Budget 2017
Top emitters: fossil fuels and industry (bar chart) Emissions by country from 2000 to 2016, with growth rates indicated for the more recent period of 2011 to 2016 Source: CDIAC; Le Quéré et al 2017;Global Carbon Budget 2017
Alternative rankings of countries Depending on perspective, the significance of individual countries changes.Emissions from fossil fuels and industry. GDP: Gross Domestic Product in Market Exchange Rates (MER) and Purchasing Power Parity (PPP)Source: CDIAC;United Nations; Le Quéré et al 2017; Global Carbon Budget 2017
Fossil fuel and industry emissions growth Emissions in the US, Russia and Brazil declined in 2016Emissions in India and all other countries combined increased Figure shows the top four countries contributing to emissions changes in 2016Source: CDIAC; Le Quéré et al 2017; Global Carbon Budget 2017
Breakdown of global emissions by country Emissions from OECD countries are about the same as in 1990Emissions from non-OECD countries have increased rapidly in the last decade Source: CDIAC; Le Quéré et al 2017;Global Carbon Budget 2017
Historical cumulative emissions by country Cumulative emissions from fossil-fuel and industry were distributed (1870–2016):USA 26%, EU28 22%, China 13%, Russia 7%, Japan 4% and India 3% Cumulative emissions (1990–2016) were distributed China 20%, USA 20%, EU28 14%, Russia 6%, India 5%, Japan 4%‘All others’ includes all other countries along with bunker fuels and statistical differencesSource: CDIAC; Le Quéré et al 2017;Global Carbon Budget 2017
Historical cumulative emissions by continent Cumulative emissions from fossil-fuel and industry (1870–2016)North America and Europe responsible for most cumulative emissions, but Asia growing fast The figure excludes bunker fuels and statistical differencesSource: CDIAC; Le Quéré et al 2017;Global Carbon Budget 2017
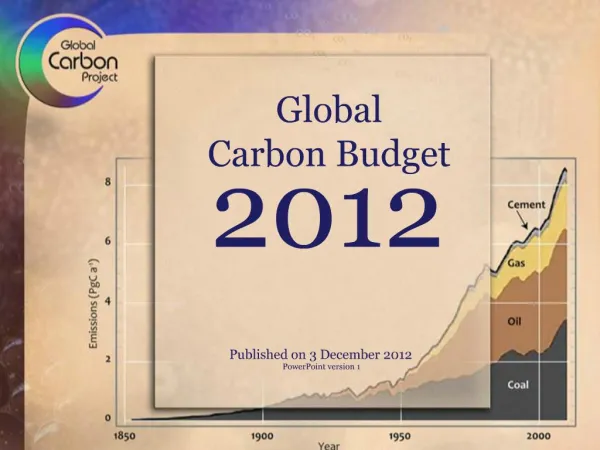
Emissions from coal, oil, gas, cement Share of global emissions in 2016:coal (40%), oil (34%), gas (19%), cement (6%), flaring (1%, not shown) Source: CDIAC; Le Quéré et al 2017;Global Carbon Budget 2017
Emissions by category Emissions by category from 2000 to 2016, with growth rates indicated for the more recent period of 2011 to 2016 Source: CDIAC; Jackson et al 2017;Global Carbon Budget 2017
Energy consumption by energy type Energy consumption by fuel source from 2000 to 2016, with growth rates indicated for the more recent period of 2011 to 2016 Source: BP 2017; Jackson et al 2017; Global Carbon Budget 2017
Fossil fuel and cement emissions growth The biggest changes in emissions were from a decline in coal and an increase in oil Source: CDIAC; Le Quéré et al 2017;Global Carbon Budget 2017
Carbon intensity of economic activity Global emissions growth has generally recovered quickly from previous financial crisesIt is unclear if the recent slowdown in global emissions is related to the Global Financial Crisis Economic activity is measured in purchasing power parity (PPP) terms in 2010 US dollars. Source: CDIAC; Peters et al 2012; Le Quéré et al 2017;Global Carbon Budget 2017
Emissions intensity per unit economic activity The 10 largest economies have a wide range of emissions intensity of economic production Emission intensity: CO2 emissions from fossil fuel and industry divided by Gross Domestic Product Source: Global Carbon Budget 2017
New generation of emissions scenarios In the lead up to the IPCC’s Sixth Assessment Report new scenarios have been developed to more systematically explore key uncertainties in future socioeconomic developments Five Shared Socioeconomic Pathways (SSPs) have been developed to explore challenges to adaptation and mitigation.Shared Policy Assumptions (SPAs) are used to achieve target forcing levels (W/m2). Marker Scenarios are indicated.Source: Riahi et al. 2016; IIASA SSP Database; Global Carbon Budget 2017
New generation of emissions scenarios In the lead up to the IPCC’s Sixth Assessment Report new scenarios have been developed to more systematically explore key uncertainties in future socioeconomic developments Five Shared Socioeconomic Pathways (SSPs) have been developed to explore challenges to adaptation and mitigation.Shared Policy Assumptions (SPAs) are used to achieve target forcing levels (W/m2). Marker Scenarios are indicated.Source: Riahi et al. 2016; IIASA SSP Database; Global Carbon Budget 2017
Pathways that avoid 2°C of warming Source: Riahi et al. 2016; IIASA SSP Database; Global Carbon Budget 2017 According to the Shared Socioeconomic Pathways (SSP) that avoid 2°C of warming, global CO2 emissions need to decline rapidly and cross zero emissions after 2050
CO2 emissions and economic activity In recent years, CO2 emissions have been almost flat despite continued economic growth Source: Jackson et al 2017; Global Carbon Budget 2017
Kaya decomposition The Kaya decomposition demonstrates the recent relative decoupling of economic growth from CO2 emissions, driven by improved energy intensity GWP: Gross World Product (economic activity), FFI: Fossil Fuel and Industry,Energy is Primary Energy from BP statistics using the substitution accounting methodSource: Jackson et al 2017; Global Carbon Budget 2017
Emissions per capita The 10 most populous countries span a wide range of development and emissions per person Emission per capita: CO2 emissions from fossil fuel and industry divided by population Source: Global Carbon Budget 2017
Source: CDIAC; Le Quéré et al 2017;Global Carbon Budget 2017 Key statistics
Consumption-based Emissions Consumption–based emissions allocate emissions to the location that goods and services are consumed Consumption-based emissions = Production/Territorial-based emissions minus emissions embodied in exports plus the emissions embodied in imports
Consumption-based emissions (carbon footprint) Allocating fossil and industry emissions to the consumption of products provides an alternative perspective. USA and EU28 are net importers of embodied emissions, China and India are net exporters. Consumption-based emissions are calculated by adjusting the standard production-based emissions to account for international tradeSource: Peters et al 2011;Le Quéré et al 2017;Global Carbon Project 2017
Consumption-based emissions (carbon footprint) Transfers of emissions embodied in trade from non-Annex B countries to Annex B countries grew at over 11% per year between 1990 and 2007, but have since declined at over 1% per year. Annex B countries were used in the Kyoto Protocol, but this distinction is less relevant in the Paris Agreement Source: CDIAC; Peters et al 2011; Le Quéré et al 2017;Global Carbon Budget 2017
Major flows from production to consumption Flows from location of generation of emissions to location ofconsumption of goods and services Values for 2011. EU is treated as one region. Units: MtCO2Source: Peters et al 2012
Major flows from extraction to consumption Flows from location of fossil fuel extraction to location ofconsumption of goods and services Values for 2011. EU is treated as one region. Units: MtCO2Source: Andrew et al 2013
Land-use change emissions Land-use change emissions are highly uncertain. Higher emissions in 2016 are linked to increased fires during dry El Niño conditions in tropical Asia Estimates from two bookkeeping models, using fire-based variability from 1997Source: Houghton and Nassikas 2017; Hansis et al 2015; van der Werf et al. 2017; Le Quéré et al 2017;Global Carbon Budget 2017 Indonesian fires
Total global emissions Total global emissions: 40.8 ± 2.7 GtCO2 in 2016, 52% over 1990Percentage land-use change: 42% in 1960, 12% averaged 2007-2016 Land-use change estimates from two bookkeeping models, using fire-based variability from 1997Source: CDIAC; Houghton and Nassikas 2017; Hansis et al 2015; van der Werf et al. 2017; Le Quéré et al 2017;Global Carbon Budget 2017
Total global emissions by source Land-use change was the dominant source of annual CO2 emissions until around 1950 Others: Emissions from cement production and gas flaringSource: CDIAC; Houghton and Nassikas 2017; Hansis et al 2015; Le Quéré et al 2017;Global Carbon Budget 2017
Historical cumulative emissions by source Land-use change represents about 31% of cumulative emissions over 1870–2016, coal 32%, oil 25%, gas 10%, and others 3% Others: Emissions from cement production and gas flaringSource: CDIAC; Houghton and Nassikas 2017; Hansis et al 2015;Le Quéré et al 2017;Global Carbon Budget 2017
Source: CDIAC; NOAA-ESRL; Houghton and Nassikas 2017; Hansis et al 2015;Le Quéré et al 2017;Global Carbon Budget 2017 Fate of anthropogenic CO2 emissions (2007–2016) Sources = Sinks 17.3 GtCO2/yr 47% 34.3 GtCO2/yr 88% 30% 11.2 GtCO2/yr 12% 4.9 GtCO2/yr 23% 8.7 GtCO2/yr 6% 2.1 GtCO2/yr Budget Imbalance: (the difference between estimated sources & sinks)
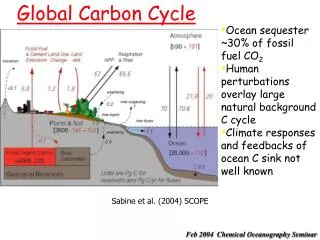
Global carbon budget Carbon emissions are partitioned among the atmosphere and carbon sinks on land and in the oceanThe “imbalance” between total emissions and total sinks reflects the gap in our understanding Source: CDIAC; NOAA-ESRL; Houghton and Nassikas 2017; Hansis et al 2015; Joos et al 2013;Khatiwala et al. 2013; DeVries 2014; Le Quéré et al 2017;Global Carbon Budget 2017
Changes in the budget over time The sinks have continued to grow with increasing emissions, but climate change will affectcarbon cycle processes in a way that will exacerbate the increase of CO2 in the atmosphere The budget imbalance is the total emissions minus the estimated growth in the atmosphere, land and ocean. It reflects the limits of our understanding of the carbon cycle. Source: CDIAC; NOAA-ESRL; Houghton and Nassikas 2017; Hansis et al 2015; Le Quéré et al 2017; Global Carbon Budget 2017
Atmospheric concentration The atmospheric concentration growth rate has shown a steady increaseThe high growth in 1987, 1998, & 2015-16 reflect a strong El Niño, which weakens the land sink Source: NOAA-ESRL; Global Carbon Budget 2017
Ocean sink The ocean carbon sink continues to increase8.7±2 GtCO2/yr for 2007–2016 and 9.6±2 GtCO2/yr in 2016 Source: SOCATv5; Bakker et al 2016; Le Quéré et al 2017;Global Carbon Budget 2017 Individual estimates from: Aumont and Bopp (2006); Buitenhuis et al. (2010); Doney et al. (2009); Hauck et al. (2016); Ilyinaet al. (2013); Landschützer et al. (2016); Law et al. (2017); ; Rödenbeck et al. (2014). Séférian et al. (2013); Schwinger et al. (2016). Full references provided in Le Quéré et al. (2017). individual ocean models this carbon budget pCO2-based flux products
Terrestrial sink The land sink was 11.2±3 GtCO2/yr during 2007-2016 and 10±3 GtCO2/yr in 2016Total CO2 fluxes on land (including land-use change) are constrained by atmospheric inversions Source: Le Quéré et al 2017;Global Carbon Budget 2017 Individual estimates from: Chevallier et al. (2005); Clarke et al. (2011); Guimberteau et al. (2017); Hansis et al. (2015); Haverd et al. (2017); Houghton and Nassikas (2017); Jain et al. (2013); Kato et al. (2013); Keller et al. (2017); Krinner et al. (2005); Melton and Arora (2016); Oleson et al. (2013); Reick et al. (2013); Rodenbeck et al. (2003); Sitch et al. (2003); Smith et al. (2014); Tian et al. (2015); van der Laan-Luijkx et al. (2017); Woodward et al. (1995);Zaehle and Friend (2010). Full references provided in Le Quéré et al. (2017). this carbon budget individual land models (mean) individual bookkeeping models atmospheric inversions
Total land and ocean fluxes Total land and ocean fluxes show more interannual variability in the tropics Source: Le Quéré et al 2017;Global Carbon Budget 2017 Individual estimates from: Aumont and Bopp (2006); Buitenhuis et al. (2010); Chevallier et al. (2005); Clarke et al. (2011); ; Doney et al. (2009); Guimberteau et al. (2017); Hauck et al. (2016); Haverd et al. (2017); Ilyinaet al. (2013); Jain et al. (2013); Kato et al. (2013); Keller et al. (2017); Krinner et al. (2005); Landschützer et al. (2016); Law et al. (2017); Melton and Arora (2016); Oleson et al. (2013); Reick et al. (2013); Rödenbeck et al. (2003); Rödenbeck et al. (2014); Séférian et al. (2013); Schwinger et al. (2016); Sitch et al. (2003); Smith et al. (2014); Tian et al. (2015); van der Laan-Luijkx et al. (2017); Woodward et al. (1995);Zaehle and Friend (2010). Full references provided in Le Quéré et al. (2017). atmospheric inversions combined land and ocean models