Download
1 / 35
360 likes | 414 Vues
Explore the key findings and methodologies of the MuLan and MuCap experiments, focusing on precise measurements of positive and negative muon lifetimes and nuclear capture rates. Discover how these ongoing experiments at the Paul Scherrer Institut contribute to understanding weak interaction parameters.

E N D
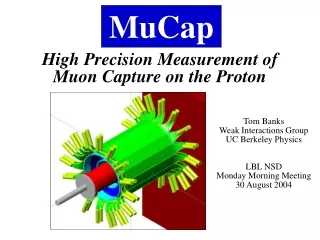
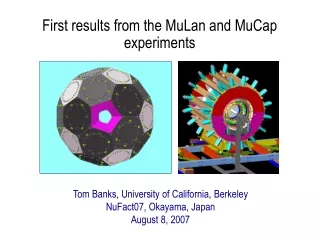
First results from the MuLan and MuCap experiments Tom Banks, University of California, Berkeley NuFact07, Okayama, Japan August 8, 2007
Sister experiments MuLan Precision measurement of the positive muon’s lifetime, to determine the Fermi constant, . MuCap Precision measurement of the negative muon’s lifetime in hydrogen gas, to determine the nuclear muon capture rate, which in turn determines the nucleon’s pseudoscalar coupling, .
Similarities • Both are ongoing experiments conducted at the Paul Scherrer Institut near Zurich, Switzerland.
Paul Scherrer Institut Villigen, Switzerland
Similarities • Both are ongoing experiments conducted at the Paul Scherrer Institut, CH. • Both use a similar experimental technique (i.e., the muon lifetime) to measure fundamental weak interaction parameters. • Overlap in personnel, equipment • Both recorded first physics data in fall 2004, and both recently published their results from that data in the same issue of PRL (July 20, 2007). The MuLan result is used to obtain the MuCap result.
The MuLan experiment: Muon Lifetime Analysis
Motivation The most precise way of determining the Fermi constant is from the mean life of the positive muon:
Motivation The most precise way of determining the Fermi constant is from the mean life of the positive muon: For a long time, the uncertainty in was dominated by the higher-order QED corrections in .
Motivation The most precise way of determining the Fermi constant is from the mean life of the positive muon: In 1999, the theoretical uncertainty was reduced to less than 0.3 ppm, shifting the focus to the muon lifetime, which has not been measured in over 20 years.
Experimental design Positive muons are stopped in a ferromagnetic target disk, and decay positrons are detected by a surrounding soccer-ball-shaped scintillator array: The goal is to ultimately record 1012 decay events in this fashion and make a 1 ppm lifetime measurement.
Lifetime spectrum A pulsed DC muon beam generates the lifetime spectrum shown.
2004 targets • Arnokrome III (AK-3) • 30% Cr, 10% Co, 60% Fe • High internal B field (~ 4000 G) • Pressed sulfur • Held in Kapton wrapping • 130 G field from Halbach magnet B B
2004 targets • Arnokrome III (AK-3) • 30% Cr, 10% Co, 60% Fe • High internal B field (~ 4000 G) • Pressed sulfur • Held in Kapton wrapping • 130 G field from Halbach magnet B B Not used for final result
Systematics When dealing with a precision experiment involving large statistics, it’s all about the systematics... Since we are measuring the lifetime, the primary challenge is avoiding “early-to-late” changes in the spectrum: “early” log(counts) “late” time • Such distortions can arise from: • muon pileup and deadtime effects, which result in missed events • instrument shifts in gain, threshold, or time response • spatial acceptance (muon polarization and spin rotation)
Systematics The final table:
Results The 1.8 x 10¹⁰ decay events in the 2004 MuLan AK-3 data yielded the result highlighted below (D. Chitwood et al., PRL 99, 032001 (2007)): Previous world average MuLan (2007) Updated world average 2.197 030(40) 2.197 013(24) 2.197 019(21) 1.166 370(10) 1.166 371(6)
Results The 1.8 x 10¹⁰ decay events in the 2004 MuLan AK-3 data yielded the result highlighted below (D. Chitwood et al., PRL 99, 032001 (2007)): 1.166 370(10) 1.166 371(6) Previous world average MuLan (2007) Updated world average FAST 2.197 030(40) 2.197 013(24) 2.197 019(21) 2.197 083(35)
Graphical summary of experiments 16 ppm 18 ppm 11 ppm 1 ppm
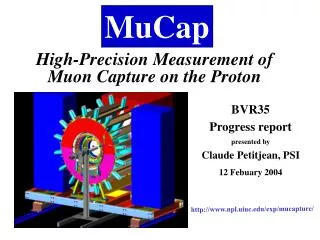
The MuCap experiment: A measurement of the Muon Capture rate in hydrogen gas
Experimental basics We measure the rate of the (semileptonic, weak) process of nuclear muon capture by the proton, by stopping negative muons in hydrogen gas and observing the time spectrum of decay electrons.
Experimental basics Negative muons can disappear via decay or nuclear capture, so they disappear at a faster rate than positive muons, which can only decay: log(counts) muon lifetime The muon capture rate can therefore be obtained from the small (0.16%) difference between the two disappearance rates:
Motivation In our gaseous hydrogen target, most muons reside in the hyperfine singlet ground state of the atom: Consequently, most captures (96%) proceed from the singlet state:
Motivation A 1% measurement of would determine the nucleon’s weak induced pseudoscalar coupling, , to 7%. ν n p μ
Motivation The pseudoscalar coupling has long been the least well known of the nucleon’s form factors. Prior to the advent of MuCap, the situation surrounding was inconclusive, because the existing theoretical and experimental values were mutually inconsistent.
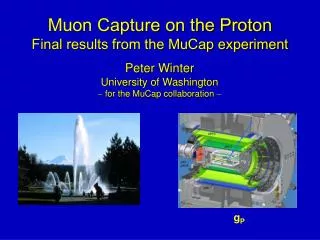
How is MuCap better? TPC 1. Target: We use a time projection chamber (TPC) operating in ultraclean, low-density hydrogen gas. This has never been done before. 2. Statistics: To measure the capture rate to 1%, we must collect 1010 negative-muon decay events. This is possible through our unique combination of detectors and analysis capabilities.
2004 data collection MuCap detectors assembled at PSI, October – November 2004.
2004 data collection MuCap detectors assembled at PSI, October – November 2004.
2004 data analysis We recorded roughly 1.6 x 10⁹ negative muon decay events during our first physics run in 2004. The muon disappearance rate is obtained by fitting the measured decay spectrum with an exponential function,
2004 data analysis However, in reality the lifetime spectrum is not a pure exponential, and the fitted disappearance rate
Summary of corrections Source Uncorrected rate Z>1 gas impurities Muon scatter events diffusion diffusion molecule formation Muon detector inefficiencies Analysis consistency mup bound state decay rate Adjusted disappearance rate 455 886.6 –19.2 –3.1 –10.2 –2.7 23.5 12.3 455 887.2 12.6 5.0 3.0 1.6 0.5 7.3 3.0 5.0 16.8 ± ± ± ± ± ± ± ± ±
Result for the capture rate Subtracting the positive muon lifetime measured by MuLan yields Roughly 13.7 Hz of the uncertainty is statistical, and 10.7 Hz is systematic. This result is consistent within 1σ with the latest theoretical calculations which predict 711.5 ± 4.5 Hz. Both results appeared in the July 20, 2007 issue of Physical Review Letters. (PRL 99, 032002 and 032003 (2007))
Implications for From the capture rate we can extract the value which is consistent with the ChPT prediction of 8.26±0.23, and therefore corroborates the modern understanding of the role of chiral symmetries in QCD.
Future During 2005 – 2007 we have continued to collect data of superior quality: • Higher statistics (roughly 1010 decay events) • Cleaner hydrogen gas:– Z>1 impurity content was reduced by a factor of 2– deuterium content was reduced by a factor of 10 • The TPC operated at a higher voltage, with increased sensitivity As a result, we expect to reduce the statistical and systematic errors by at least a factor of two. Analysis of recent data is in progress, and we hope to reach the design goal of a 1% capture measurement.
Collaborating InstitutionsPetersburg Nuclear Physics Institute (PNPI), Gatchina, RussiaPaul Scherrer Institute (PSI), Villigen, SwitzerlandUniversity of California, Berkeley (UCB and LBNL), USAUniversity of Illinois, Urbana-Champaign (UIUC), USAUniversite Catholique de Louvain, BelgiumUniversity of Kentucky, USABoston University, USA The MuCap experiment is supported in part by the United States Department of Energy and the National Science Foundation. www.npl.uiuc.edu/exp/mucapture