Download
1 / 4
40 likes | 169 Vues
Bharat Book introduces a report "Table Sauces in US (2012) - Market Sizes". Population, Consumer Price Index (CPI), Gross Domestic Product (GDP), Exchange Rates.

E N D
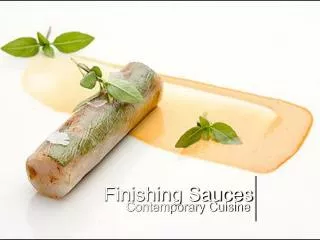
Table Sauces in US (2012) - Market Sizes Bharat Book Bureauwww.bharatbook.com
Summary Table Sauces in US provides you with annual year-end market size data, most recently updated in 2012. This market covers bottled/packaged ambient; tomato ketchup, salad dressing, mayonnaise, mustard, brown, soy and other table sauces which accompany food at the time of eating. It includes all soy sauces whether used as cooking or table sauce. Market value and volume comprises sales through all retail channels including direct to consumer. Market size for Table Sauces in US is given in %, USD and tonnes with a minimum of five years' historical data. Market Forecast is provided for five years. Included with this snapshot is socio-economic data for US. Population, Consumer Price Index (CPI), Gross Domestic Product (GDP), Exchange Rates. http://www.bharatbook.com/market-research-reports/food-market-research-report/table-sauces-in-us-2012-market-sizes.html Description Segmentation of this market Brown Mayonnaise Mustard Other Table Sauces
Table of Contents: Market size Highlights - strongest and weakest performers Figure 1: Volume - Absolute size (2006 - 2016) Figure 2: Volume - Growth (2006 - 2016) Table 1: Volume (2006 - 2016) Figure 3: Value in Local Currency - Value (2006 - 2016) Figure 4: Value in Local Currency - Value growth (2006 - 2016) Table 2: Value in Local Currency (2006 - 2016) Figure 5: Value in USD - Value (2006 - 2016) Figure 6: Value in USD - Value growth (2006 - 2016) Table 3: Value in USD (2006 - 2016)Market segmentationFigure 7: US - Table Sauces: Market segmentation by volume ((000) tonnes) (2006 - 2011)Table 4: US - Table Sauces: Market segmentation by volume ((000) tonnes) (2006 - 2011)
For more information: Bharat Book Bureau Phone : +91 22 27810772, 27810773 Fax : +91 22 27812290 E-mail : info@bharatbook.com Website : www.bharatbook.com • Kindly click on : http://www.bharatbook.com/market-research-reports/food-market-research-report/table-sauces-in-us-2012-market-sizes.html Or visit