Download
1 / 17
170 likes | 191 Vues
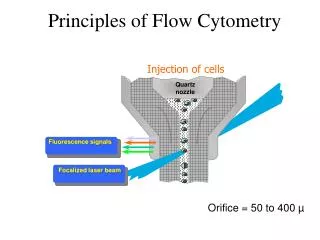
Sergey Gloushen. B e l a r u s s i a n S t a t e U n i v e r s i t y. Topological parameters as a new class of descriptors in cytometry of tumors. Significance of cytometry for the investigation of tumors.

E N D
Sergey Gloushen B e l a r u s s i a n S t a t e U n i v e r s i t y Topological parameters as a new class of descriptors in cytometry of tumors
Significance of cytometry for the investigation of tumors • There are several distinctive features of tumors in comparison with normal tissue - immortality of cells, permanent growth, genetic instability, partial cell dedifferentiation, independence from growth factors, powered glycolysis, competition between cells, high level of heterogeneity and others. • Being a system pathology of cell populations tumors arise as the result of long and many-stepped alterations of genetically dependent signal pathways that have control over proliferation, apoptosis and differentiation of cells. • The system character of tumor progression is manifested in a broad variety of features of individual cells and their statistical distribution within cell populations. • High heterogeneity of tumors and their system nature increase a significance of morphological approaches and, especially. image cytometry as bases for synthesis of different scientific data and creation of novel or improvement of old methods for diagnostics and prognosis of development of cancer.
H i s t o l o g y o f t h y r o i d t u m o r s • This is microscopic appearance of a follicular adenoma of the thyroid. It is at the center to upper left and closely resembles normal tissue located at the lower right. • A papillary carcinoma of the thyroid differs from normal tissue and adenoma. Its fonds have thin fibrovascular cores and overal papillary pattern.
C y t o l o g y o f t h y r o i d t u m o r s • A cytologic diagnostics of thyroid tumors is based on the fine needle aspiration biopsy (FNAB). Follicular adenoma cells at the upper image are very similar in morphology. Their rounded and deep stained nuclei have the same size. • Papillary carcinoma cells at the lower image differ from adenoma ones in size, shape and optical density of nuclei. However an accuracy of cytological diagnosis from FNAB’s specimens can be decreased in comparison with hystology through the loss of tissue architecture.
Cell composition of a follicular adenoma At high power of microscope it is seen that the adenoma possess small heterogeneity caused by proliferation. Being limited in number of cell divisions adenomas of the thyroid have not a great potency to permanent growth and acquisition of malignancy.
Cell composition of a papillary carcinoma There are the number of differences between cells of adenoma and carcinoma of the thyroid. Apart from enlarged size and irregular shape of some nuclei it is clear seen that the adenoma has got abnormality of chromatin. Light zones - “watch-glasses” appeared in separate cells.
Representation of digital image of cell nucleus as a three dimentional surface A digital image of cell nucleus may be considered the surface with coordinates X, Y and Brightness instead of Z. In this case the problem to create invariant in some sense “numerical portrait” of a nucleus brings about quantitative evaluations of the pseudosurface.
Quantification of 3d-surface by isophotes One of possible ways to estimate roughness of 3d-surface of cell nucleus image (A) is to draw on it lines with equal brightness - isophotes (B). The following calculation of total length of isophotes on preset level of brightness will be a quantitative descriptor of chromatin structure detected at this level of brightness. Changing level of brightness from zero to maximum we shall get the nonlinear curve that describes a distribution of chromatin in cell nucleus (C).
Fractal area profile of cell nucleus If isophotes are drawn at every level of brightness they correspond to sums of perimeters of intranuclear structures. The dependence between total length of perimeters and image brightness named by us as "Fractal Area Profile" (FAP). FAP has the maximum (B) that divides it into two parts. The left part (A - B) reflects distribution of heterochromatin and the right one (B - C) describes distribution of euchromatin. Shapes of FAPs may differ amongst cells of thyroid tumors and correlate with morphological alterations of cell nuclei.
Relative fractal areas of cell nucleiof thyroid tumors To statistical analysis of thyroid tumors a FAP was fragmented using its derivatives into separate squares - fractal areas of heterochromatin grains (1) and ties (2), euchromatin transitions (3) and spots (4) , diffuse component (5), total heterochromatin (6), and total euchromatin (7). Dividing these parameters by total fractal area of nucleus we shall get the set of relative fractal areas (RFA). Statistical estimation of 20 FNAB’s specimens by RFA revealed significant differences of almost all of the parameters between follicular adenoma and papillary carcinoma of the thyroid.
Relative fractal areas of nucleiin thyroid tumor cell lines We invesigated also RFAs of nuclei in three cell cultures of thyroid tumors: HDC - high differentiated cancer, LDC - low differentiated cancer and AnaC - anaplastic cancer. It is clear some changes of chromatin structures in cell lines with different levels of malignity.
Segmentation of image of cell nucleus on the basis of its fractal area profile Besides the application of FAP for evaluation of morphology of cancer cells this curve may be used for segmentation of its images into components. This method is based on ability of FAP to display transitions of brightness in chromatin pattern. Using this method images of adenoma and cancer cell nuclei (Ad and Cr) may be segmented into 3 parts: full nucleus (blue), intermediate heterochromatin (green), dark heterochromatin (yellow).
Influence of optical resolution on fractal area profile Optical resolution is the main characteristics of any image analysis system. It may be measured after Fast Fourie Transform of digital images to frequency domain. Optical distortions may be corrected by deconvolution of images with point spread function of microscope. It is clear that high optical resolution increases fractal area of cell nucleus and height of its FAP. In such the manner fractal nature of FAP is manifested.
Similarity of fractal area profileand histogram of brightness There is the obvious similarity of fractal area profile of cell nucleus and its histogram of brightness (blue). This similarity is displayed in shape of these curves but their absolute values are still quite different. For images of cell nuclei absolute values of fractal area profiles are significantly higher in comparison with the histograms of brightness. It may be shown yet there are some transformations of images that it is not true for.
Randomized images of cell nuclei One of these transformations is the randomization of pixels within an area occupated by picture of cell nucleus. The algorithm of randomization applied here accomplishes twin permutations of pixels all over that area. As a result the image preserves information only about size, shape and optical density of nucleus. It is important to point out that the histogram of brightness does not changed. However these randomized images have not any information about inner structure of cell nucleus.
Difference between fractal area profile and histogram of brightness In spite of the invariability of histogram of brightness fractal area profile of randomized images alters drastically. This takes place due to principal differencies between histogram of brightness and fractal area profile. Randomly distributed permutations of pixels do not affect the first oder statistics of image but disturb some other properties. Among them there is a connectivity of chromatin structures that may be determined through the notion of “frontier”. Since FAP counts just pixels of frontiers it must contain topological information.
Conclusions • Cytometry is able to give valuable information about pathological alterations of tumor cells that may be used for the impovement of diagnostic and prognostic methods. • Selection of parameters for quantitative estimation of disoders in a nucleus is the crucial step for cytometry of tumor cells. We propose the new cytometrical parameter - fractal area profile (FAP) of cell nucleus. It is determined as the dependence between perimeter of chromatin structures and level of their brightness in microscopic images. • FAP contains information about size, shape and optical density of cell nucleus. Moreover, it simultaneously registers a connectivity of chromatin structures and thus has got topological content. • There are statistically reliable peculiarities of FAPs of cell nuclei from follicular adenoma and papillary carcinoma of the thyroid and between thyroid cell lines which differ in malignity. • FAP belongs to a new class of cytometrical descriptors suitable to estimation of topological properties of chromatin in tumor cells.