Experimental Design and Analysis of Variance: Basic Design
910 likes | 954 Vues
Explore the concept of experimental design and analysis of variance in research studies. Learn about the characteristics of experiments, steps involved in constructing an experiment, experimental units and replications, experimental errors, and the importance of experimental design. Understand key terms like treatment, variable, randomization, replication, null hypothesis, factors, levels, and response.

Experimental Design and Analysis of Variance: Basic Design
E N D
Presentation Transcript
Experimental Design and Analysis of Variance:Basic Design M. Ali Akbar Professor Fakulti of Agro Industri dan Sumber Asli
Meaning of the term “Experiment” Experiment: Planned research conducted for certain period to obtain new facts or to confirm or refute the results of previous study
Characteristics of Experiment • Needs a hypothesis to be nullified • Involves observation, collection and measurements of data on the experimental object (s) & its analyses and interpretation • Frequently needs controlled environment for data collection/observation • Needs appropriate designing to get authentic results • Helps researchers to get an answer to some questions or to make an inference about some phenomenon
Steps in constructing an experiment: • Selection of problem based on current issues and its rationale • Gathering information related to the problem • Setting the hypothesis and the objectives • Planning and designing the experiment • Defining the materials and methods • Commencement of work and collection of data and information, analyses and interpretation of results considering observations of other researchers • Conclusions and/or recommendations on the findings
Experimental Units and Replications • Experimental unit is a material to which the treatment is applied;crop plots, cattle etc Characteristics of exptl. unit is that they are independent of one another • Sample may be part of exptl. unit;no. of chicken in a cage denotes chick as sample and cage as unit; again in expt of weight gain of calves, calf is both experimental unit as well as sample • Replication is the application of treatment to more than one experimental unit in an experiment • They are several exptl. units all treated similarly
Experimental error • Variability is the characteristics of biological materials • Total variability can be partitioned into or due to (a) explained and (b) unexplained causes • So observations in an exptl. unit differ because they belong to explained & unexplained effects • Experimental error is of two types: systematic and random. • Systematic error change the measurements in a consistent way & comes from definite source e.g. ununiformity in the units such as uncalibrated instruments
Random error occur due to random and unpredictable phenomena • They produce variability which can not be explained • In biological material there are always random errors in measurements e.g. individual variation in livestock sample • Random errors can be minimised by increasing the number of replicates
Experimental Design The term experimental design refers to a plan for assigning experimental units to treatment conditions in a systematic way so that the results can give meaningful output. It is not just describing the natural event through observation and measurement, but it is more of treating the observation and measurement in a planned way to illuminate the effect of any change in conditions. The importance of experimental design also stems from the quest for inference about effect of causes or relationships as opposed to simply description. Researchers are rarely satisfied to simply describe the events they observe. They want to make inferences about what produced, contributed to, or caused events.
Important terminology Treatment: A condition (or set conditions) that is imposed on a group of elements (subjects) by the experimenter is called treatment Variable: Any concept, or thing, or event that varies or can be made to vary, and is related to the research can be called a variable. Dependent variable: The variable that is changed by the change of another variable is called dependent variable Independent variable: The variable that is not changed due to change in another variable rather when it changes also causes change in another variable Randomisation: The procedure in which elements (subjects) are assigned to different groups at random (without any bias)
Replication: Repetition of experimental units in a treatment which is intended to minimise the experimental error is called replication. Null hypothesis: The assumption that there is no effect of independent variable on the dependent one. Factor: Factors can be classified as either controllable or uncontrollable variables. For example, in cake making the controllable factors are the ingredients for the cake and the oven that the cake is baked in. Levels: or settings of each factor. Examples include the oven temperature setting and the amounts of sugar, flour, and eggs. Response: or output of the experiment. In the case of cake baking, the taste, consistency, and appearance of the cake are measurable outcomes potentially influenced by the factors and their respective levels.
Why Experimental Design? • Obtain maximum information from fewest experiments — minimize time spent in gathering data • Quantify effects from different factors using analysis • Determine if a factor’s effect is significant —differences might be random variations caused by – measurement errors – parameters not controlled
A good experimental design serves three purposes: Causation. It allows the experimenter to make causal inferences about the relationship between independent variables and a dependent variable. Control. It allows the experimenter to rule out alternative explanations due to the confounding effects of extraneous variables (i.e., variables other than the independent variables). Variability. It reduces variability within treatment conditions, which makes it easier to detect differences in treatment outcomes.
Principles of Design of Experiment According to Prof. R. A. Fisher, the basic principles of design of experiments are: Randomisation Replication and Error control Randomisation and Replication are described earlier Error control: Although every experiment would provide an estimate of error variance, it is not desirable to have large number of error. There are measures to reduce error variance. This measure for reducing the error variance in an experiment is called error control. There are two methods of reducing error control: one is to make experimental unit homogenous, the other is to form experimental units into several homogenous groups called blocks
Important steps in designing an experiment The statement of problem should be clearly defined. The experimenter must understand what to do and how to tackle the problems Formulation of hypothesis should be done properly and thus the method of collection of data can be determined Experiment should be conducted accordingly and proper statistical techniques are to be applied on data Drawing of valid conclusion is a crucial part of the design of experiment so careful consideration to be given to the validity of the conclusion for the population of events to which they are to apply
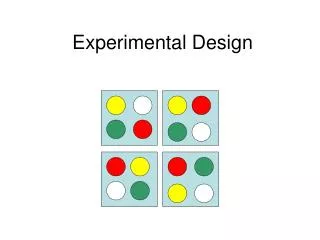
Basic Experimental Designs One-Shot One-Group, Pre-Post Static Group Random Group Pre-Post Randomised Group Completely Randomised Randomized Block Factorial Latin Square
One-shot The One-Shot is a design in which a group of subjects are administered a treatment and then measured (or observed). Usually, with this design, an intact group of subjects is given the treatment and then measured or observed. No attempt is made to randomly assign subjects to the groups, nor does the design provide for any additional groups as comparisons. Thus, one group will be given one treatment and one "observation." This design is diagramed as follows: GP--T--O The One-Shot Design is highly useful as an inexpensive measure of a new treatment of the group in question. If there is some question as to whether any expected effects will result from the treatment, then a one-shot may be an economical route. This design answers only one question and that is in reference to post-treatment behaviour.
One-Group, Pre-Post In this design, one group is given a pre-treatment measurement or observation, the experimental treatment, and a post-treatment measurement or observation. The post-treatment measures are compared with their pre-treatment measures. This design is diagramed as follows: GP--O--T--O The usefulness of this design is similar to that of one-shot, except that an additional class of information is provided, i.e., pre-treatment condition or behaviuor. This design is frequently used in clinical and education research to determine if changes occurred. It is typically analyzed with a matched pairs t-test.
Static Group In this design, two intact groups are used, but only one of them is given the experimental treatment. At the end of the treatment, both groups are observed or measured to see if there is a difference between them as a result of the treatment. The design is diagrammed as follows: GP--T—O, GP------O This design may provide information on some rival hypotheses. Whether it does or not depends on the initial comparability of the two groups and whether their experience during the experiment differs in relevant ways only by the treatment itself. Whether the groups were comparable or not is crucial in determining the extent of information yielded by this design. The design is could be used to compare the value of a drug. If the designer cannot, on the basis of information outside the experiment itself, assume the comparability of the groups.
Random Group This design is similar to the Static Group design except than an attempt is made to ensure similarity of the groups before treatment begins. Since it is difficult to have exactly similar subjects in each of two groups (unless you separate identical twins), the design works toward a guarantee of comparability between groups by assigning subjects to groups at random. If the researcher does this there is likely to be reasonable comparability between the two groups. This design can be diagrammed as: R--GP--T—O, R---GP------O It is economical. It provides fairly clear-cut information as to the relationship between treatment and post-treatment measurement or behaviours. Since this is often the sole reason for the research, the randomized group design is frequently the appropriate selection.
Pre-Post Randomized Group This design adds a pre-test to the previous design as a check on the degree of comparability of the control and experimental groups before the treatment is given. This experimental design could be diagrammed as: R--GP--O--T—O, R--GP--O------O This yields information on post-treatment behavior and a comparison of post-treatment behavior between groups. It answers most of the class I questions, that is, threats to internal validity. The groups are comparable because they are randomized.
Completely Randomised The design deals with only two principles viz. replication and randomisation are used in the experiment. In this design the experimental materials are randomly assigned to the treatments to make them homogenous in nature and assume that there is no significant variation among them. It is diagrammed as follows: R----GR----T----O It is divided into number of experimental plots depending on the number of treatments and number of replications for each treatment. The randomisation must be as complete as possible.
Randomized Block This design is of particular value when the experimenter wishes to determine the effect of a treatment on different types of subjects within a group. This design can be diagrammed as: ----------BLK--T—O, R—GP, ----------BLK--T—O, ---------BLK------O, R—GP, ----------BLK------O Typically, this design refers to blocking or grouping of subjects with similar characteristics into treatment subgroups. The group to be used in an experiment is usually given some pre-treatment measure, or previous records are examined, and the entire group is blocked or sorted into categories. Then equal numbers from each category are assigned to the various treatment and/or control groups.
Factorial As you saw above in the blocking design, the subjects were assigned to different groups on the basis of some of their own characteristics such as age, weight, gender etc. Sometimes we wish to assign different variations of the treatment as well, and the procedure is similar. For example, we may wish to try two kinds of treatments varied in two ways (called a 2x2 factorial design). Some factorial designs include both assignment of subjects (blocking) and several types of experimental treatment in the same experiment. When this is done it is considered to be a factorial design. A diagram of a 2x2 factorial design would look like: R--GP--T-------O, A1 B1, R--GP--T-------O, A1 B2 R--GP--T-------O, A2 B1, R--GP--T-------O, A2 B2
The factorial design as we are describing is really a complete factorial design of which there are several variations. The factorial is used when we wish information concerning the effects of different kinds or intensities of treatments. The factorial design provides relatively economical information not only about the effects of each treatment, level or kind, but also about interaction effects of the treatment. In a single 2x2 factorial design information can be gained about the effects of each of the two treatments and the effect of the two levels within each treatment, and the interaction of the treatments. If all these are questions of interest, the factorial design is much more economical than running separate experiments.
Latin Square A researcher may wish to use several different treatments in the same experiment, for example the relative effects of an assortment of perhaps three or more drugs in combination in which the sequence of administration may produce different results. A diagram of a three treatment Latin Square design is: R--GP--TA--O--TB--O--TC--O R--GP--TB--O--TC--O--TA--O R--GP--TC--O--TA--O--TB--O If all possible sequencing permutations had to be addressed, there would be 3x2=6 possible arrangements--a doubling of cost. The original 3-treatment design would, however, answer the question whether sequencing made a difference without testing all possible sequences.
Types of experimental Design (commonly used) Completely Randomised Design (CRD) Randomised Complete Block Design (RCBD) Or Randomised Block Design (RBD) Latin Square Design Factorial Design Split Plot Design
An Example of Experimental Designs Consider the following hypothetical experiment: Acme Medicine is conducting an experiment to test a new vaccine, developed to immunize people against the common cold. To test the vaccine, Acme has 1000 volunteers: 500 men and 500 women. The participants’ age ranges from 21 to 70. In this lesson, we can describe two experimental designs: - a completely randomized design, a randomized block design, and a matched pairs design. And we show how each design might be applied by Acme Medicine to understand the effect of the vaccine, while ruling out confounding effects of other factors.
Experimental Design and Analysis of Variance: Completely Randomised Design What is CRD? It is the simplest type of the basic designs, may be defined as a design in which the treatments are assigned to experimental units completely at random, that is the randomization is done without any restrictions. The design is completely flexible, i.e., any number of treatments and any number of units per treatment may be used. A completely randomized design is considered to be most useful in situations where (i) the experimental units are homogeneous, (ii) the experiments are relatively small and (iii) the number of treatments is relatively small.
A completely randomized design (CRD) relies on randomization to control for the effects of extraneous variables. The experimenter assumes that, on average, extraneous factors will affect treatment conditions equally So, any significant differences between conditions can fairly be attributed to the independent variable.
Usage of CRD Simplest design to use. Design can be used when experimental units are essentially homogeneous. Because of the homogeneity requirement, it may be difficult to use this design for field experiments. The CRD is best suited for experiments with a small number of treatments. Randomization Procedure -Treatments are assigned to experimental units completely at random. -Every experimental unit has the same probability of receiving any treatment. -Randomization is performed using a random number table, computer, program, etc.
Advantages of a CRD Very flexible design (i.e. number of treatments and replicates is only limited by the available number of experimental units). Statistical analysis is simple compared to other designs. 3. Loss of information due to missing data is small compared to other designs due to the larger number of degrees of freedom for the error source of variation. Disadvantages 1. If experimental units are not homogeneous and you fail to minimize this variation using blocking, there may be a loss of precision. 2. Usually the least efficient design unless experimental units are homogeneous. 3. Not suited for a large number of treatments.
An Example of Completely Randomised Design Consider the following hypothetical experiment: ACME Medicine is conducting an experiment to test a new vaccine, developed to immunize people against the common cold. To test the vaccine, ACME has 1000 volunteers: 500 men and 500 women. The participants’ age ranges from 21 to 70. In this example we show how the design might be applied by ACME Medicine to understand the effect of the vaccine, while ruling out confounding effects of other factors.
The completely randomized design is probably the simplest experimental design, in terms of data analysis and convenience. With this design, participants are randomly assigned to treatments. A CRD layout for the Acme Experiment is shown in the above table. In this design, the experimenter randomly assigned participants to one of two treatment conditions. They received a Placebo or they received the Vaccine The same number of participants (500) were assigned to each treatment condition (although this is not required). The dependent variable is the number of colds reported in each treatment condition. If the vaccine is effective, participants in the "vaccine" condition should report significantly fewer colds than participants in the "placebo" condition.
Let us take another example: Suppose you have 4 different diets A, B, C & D and you want to examine the effect of diets on weight gain of 16 rabbits. The rabbits should be kept in cages of four shelves one above another and each shelf has four chambers. How should you use randomization to assign the rabbits to the 4 treatments and for which to put them into 16 cages? You have to make complete randomisation, not part of it.
One way of doing is: • Label the cages 1-16. In a bowl put 16 strips of paper each with one of the integers 1-16 written on it. • In a second bowl put 16 strips of paper, four each labelled A, • B, C, and D. • Catch a rabbit. Select a number and a letter from each bowl. Place the rabbit in the cage indicated by the number and feed it the diet assigned by the letter. • Repeat without replacement of the used paper strips until all rabbits have been assigned a diet and cage. That will give you: • Notice that the completely randomized • design does not account for the • difference in heights of the cages nor • position of cages in the room. It is just • as the name suggests, a completely • random assignment.
DATA ANALYSISOne-Way ANOVA To analyze the results of the experiment, we use a one-way analysis of variance. The measured live weight of rabbit for each diet are given below: The null hypothesis is H0: µA = µB =µC =µD (all treatment means the same) and the alternative is Ha : at least one mean different.
The CRD model is: Where is the overall mean is the i th observation under the j th treatment of the factor feed is the effect of the j th treatment of the factor feed is the random error associated with the i th observation under the j th treatment of the factor feed
k = number of treatments. In our example, there are 4 treatment classes, Diet A, Diet B, Diet C, and Diet D. nj = number of observations for j th treatment. Each of the treatments in this experiment have four observations, n1 =n2 = n3 = n4 = 4 . N = total number of observations, In this case, N = 16.
SS total = SS treatments = SS error = SS total – SS treatments Y.1 = 244, Y.2 =265, Y.3 =272, Y.4 =239
SS total = = (62)2 + (63)2 + ….+ (61)2 + (67)2 – (1020)2/16 = 275 SS treatments = = {(244)2 + (265)2 + (272)2 + (239)2}/4 – (1020)2/16 = 191.5 SS error = SS total – SS treatments = 275 – 191.5 = 83.5
Treatment MSis SS(tret) divided by tret DF = 191.5/3 = 63.833 Divide SS(error) by the error degrees of freedom, N – k to get Error MS, 83.5/12 = 6.95833 Now, divide Treatment MS by Error MS to get F value, here 63.833/6.95833 = 9.1737. Now u have to compare it with Tabular F value to find the significant variation among treatements
Problem: You have 3 different diets A, B and C. You have given 9 milking cows to see the effect of feeding diets on milk production. Suppose you have the following data on milk yield as affected by the diets: Analyse data to see whether there are significance differences among the treatment effects.
Experimental Design and Analysis of Variance:Randomised Block Design OR Randomised Complete Block Design What is RBD or RCBD? A randomized block design is a restricted randomization design in which the experimental units are first sorted into homogeneous groups, called blocks, and the treatments are then assigned at random within the blocks. The randomized block design is an improvement over the completely randomized design. Both designs use randomization to guard against confounding effect or error. But only the randomized block design more accurately controls for gender.
If you consider the example of ACME vaccine. The experimenter divides participants into subgroups called blocks, such that the variability within blocks is less than the variability between blocks. Then, participants within each block are randomly assigned to treatment conditions. Because this design reduces variability and potential confounding, it produces a better estimate of treatment effects than CRD.
The table to the left shows the rando- mised complete block design (RCBD). Participants are assigned to blocks based on gender. Then within each block participants are randomly assigned to treatments. For this design, 250 men get the placebo, 250 men get the vaccine, 250 women get the placebo, and 250 women get the vaccine. It is known that men and women are physiologically different and react differently to medication. This design ensures that each treatment condition has an equal proportion of men and women. As a result, differences between treatment conditions cannot be attributed to gender. This randomized block design removes gender as a potential source of variability and as a potential confounding variable.
Randomisation Let us take the example of the rabbit experiment of CRD In the previous section, we analyzed results from a completely randomized design (CRD) with a one-way analysis of variance. This design ignored the physical layout of the cages and the potential effect of the height of cage in which rabbits were housed. If we wanted to acknowledge the potential effect of height of the cage on weight gain, we should organize the experiment using a randomized complete block design. One diet of each type will be used on each of the 4 shelves. The randomization procedure would assign a number 1-16 to each of the rabbits.
Put four paper slips marked as A, B, C and D (as feed type) in a bowl. Put 16 paper slips numbering from 1 – 16 (rabbit number) in a 2nd bowl. Take a number at random from 2nd bowl to select a rabbit for Diet A Now take a number out of the 1st bowl to select a position on the top row. Repeat three times without replacement for Diets B, C, and D to complete the assignment to the top row. Follow the same procedure to assign the other three rows.