Download
1 / 85
890 likes | 1.45k Vues
Unit 2: Supply, Demand, and Consumer Choice. Unit 2: Supply, Demand, and Consumer Choice. Length: 3 Weeks Chapters: 3, 18. 19, 20 Activity: Pearl Exchange Assignment: PS #2. 2. DEMAND DEFINED. What is Demand?

E N D
Unit 2: Supply, Demand, and Consumer Choice Length: 3 Weeks Chapters: 3, 18. 19, 20 Activity: Pearl Exchange Assignment: PS #2 2
DEMAND DEFINED • What is Demand? • Demand is the different quantities of goods that consumers are willing and able to buy at different prices. • (Ex: Bill Gates is able to purchase a Ferrari, but if he isn’t willing he has NO demand for one) • What is the Law of Demand? • The law of demand states there is an INVERSE relationship between price and quantity demanded 3
Why does the Law of Demand occur? The law of demand is the result of three separate behavior patterns that overlap: The Substitution effect The Income effect The Law of Diminishing Marginal Utility We will define and explain each… 4
If the price goes up for a product, consumer buy less of that product and more of another substitute product (and vice versa) If the price goes down for a product, the purchasing power increases for consumers, allowing them to purchase more of it. Why does the Law of Demand occur? 1. The Substitution Effect 2. The Income Effect 5
Utility = Satisfaction We buy goods because we get utility from them The law of diminishing marginal utilitystates that as you consume more units of any good, the additional satisfaction from each additional unit will eventually start to decrease In other words, the more you buy of ANY GOOD, the less satisfaction you get from each new unit. Discussion Questions: What does this have to do with the Law of Demand? How does this effect the pricing of businesses? Why does the Law of Demand occur? 3. Law of Diminishing Marginal Utility U- TIL- IT- Y 6
The Demand Curve A demand curve is a graphic representation of a demand schedule. The demand curve is downward sloping showing the inverse relationship between price (on the y-axis) and quantity demanded (on the x-axis) When reading a demand curve, assume all outside factors, such as income, are held constant. (This is called ceteris paribus) Let’s draw a new demand curve for cereal… 7
GRAPHING DEMAND Demand Schedule Price of Cereal $5 4 3 2 1 Demand o Q 10 20 30 40 50 60 70 80 Quantity of Cereal 8
Where do you get the Market Demand? Billy Jean Other Individuals Market P P P P $3 $3 $3 $3 D D D D Q Q Q Q 3 2 25 30
Shifts in Demand CHANGES IN DEMAND Ceteris paribus-“all other things held constant.” When the ceteris paribus assumption is dropped, movement no longer occurs along the demand curve. Rather, the entire demand curve shifts. A shift means that at the same prices, more people are willing and able to purchase that good. This is a change in demand, not a change in quantity demanded Changes in price DON’T shift the curve! 10
Change in Demand Demand Schedule What if cereal makes you smarter? Price of Cereal $5 4 3 2 1 Demand o Q 10 20 30 40 50 60 70 80 Quantity of Cereal 11
Change in Demand Demand Schedule Price of Cereal Increase in Demand Prices didn’t change but people want MORE cereal at every price $5 4 3 2 1 D2 Demand o Q 10 20 30 40 50 60 70 80 Quantity of Cereal 12
Change in Demand Demand Schedule What if cereal causes baldness? Price of Cereal $5 4 3 2 1 Demand o Q 10 20 30 40 50 60 70 80 Quantity of Cereal 13
Change in Demand Demand Schedule Price of Cereal $5 4 3 2 1 Decrease in Demand Prices didn’t change but people want LESS cereal at every price D2 Demand o Q 10 20 30 40 50 60 70 80 Quantity of Cereal 14
What Causes a Shift in Demand? • 5 Determinants (SHIFTERS) of Demand: • Tastes and Preferences • Number of Consumers • Price of Related Goods • Income • Future Expectations • (Take No Prisoners In Football!) • Changes in PRICE don’t shift the curve. It only causes movement along the curve. 15
Prices of Related Goods 2. Complements are two goods that are bought and used together. If the price of one increase, the demand for the other will fall. (or vice versa) Ex: If price of skis falls, demand for ski boots will... Substitutes are goods used in place of one another. If the price of one increases, the demand for the other will increase (or vice versa) Ex: If price of Pepsi falls, demand for Coke will… The demand curve for one good can be affected by a change in the price of ANOTHER related good. 16
Income 2. Inferior Goods As income increases, demand falls As income falls, demand increases Ex: Top Ramen, used cars, used cloths, Normal Goods As income increases, demand increases As income falls, demand falls Ex: Luxury cars, Sea Food, jewelry, homes The incomes of consumers change the demand, but how depends on the type of good. 17
Change in Qd vs. Change in Demand There are two ways to increase quantity from 10 to 20 Price of Cereal P • A to B is a change in quantity demand (due to a change in price) • A to C is a change in demand (shift in the curve) A C $3 $2 B D2 D1 o Q Cereal 10 20 Quantity of Cereal
Practice First, identify the determinant (shifter), then decide if demand will increase or decrease 19
Practice Hamburgers (a normal good) Population boom Incomes fall due to recession Price for Carne Asada burritos falls to $1 Price increases to $5 for hamburgers New health craze- “No ground beef” Hamburger restaurants announce that they will significantly increase prices NEXT month Government heavily taxes shake and fries, causes their prices to quadruple. Restaurants lower price of burgers to $.50 First identify the determinant (Shifter). Then decide if demand will increase or decrease 20
Supply 21
Supply Defined • What is supply? • Supply is the different quantities of a good that sellers are willing and able to sell (produce) at different prices. • What is the Law of Supply? • There is a DIRECT (or positive) relationship between price and quantity supplied. • As price increases, the quantity producers make increases • As price falls, the quantity producers make falls. • Why? Because, at higher prices, profit-seeking firms have an incentive to produce more. EXAMPLE: Mowing Lawns 22
GRAPHING SUPPLY Supply Schedule Price of Cereal Supply $5 4 3 2 1 o Q 10 20 30 40 50 60 70 80 Quantity of Cereal 23
GRAPHING SUPPLY Supply Schedule What if new companies start making cereal? Price of Cereal Supply $5 4 3 2 1 o Q 10 20 30 40 50 60 70 80 Quantity of Cereal 24
Change in Supply Supply Schedule Price of Cereal Supply S2 $5 4 3 2 1 Increase in Supply Prices didn’t change but there is MORE cereal produced at every price o Q 10 20 30 40 50 60 70 80 Quantity of Cereal 25
Change in Supply Supply Schedule What if a drought destroys corn and wheat crops? Price of Cereal Supply $5 4 3 2 1 o Q 10 20 30 40 50 60 70 80 Quantity of Cereal 26
Change in Supply Supply Schedule Price of Cereal Supply S2 $5 4 3 2 1 Decrease in Supply Prices didn’t change but there is LESS cereal produced at every price o Q 10 20 30 40 50 60 70 80 Quantity of Cereal 27
6 Determinants (SHIFTERS) of Supply Prices/Availability of inputs (resources) Number of Sellers Technology Government Action: Taxes & Subsidies 5. Opportunity Cost of Alternative Production 6. Expectations of Future Profit Changes in PRICE don’t shift the curve; that only causes movement along the curve. 28
Supply Practice First, identify the determinant (shifter) then decide if supply will increase or decrease 29
Supply Practice Hamburgers Mad cow kills 20% of cows Price of burgers increase 30% Government taxes burger producers Restaurants can produce burgers and/or tacos. A demand increase causes the price for tacos to increase 500% New bun-baking technology cuts production time in half Minimum wage increases to $10 • Which determinant (SHIFTER)? • Increase or decrease? • Which direction will curve shift? 30
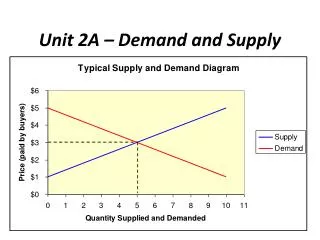
Supply and Demand are put together to determine equilibrium price and equilibrium quantity P Supply Schedule Demand Schedule S $5 4 3 2 1 Equilibrium Price = $3 (Qd=Qs) D o Q 10 20 30 40 50 60 70 80 Equilibrium Quantity is 30 31
Supply and Demand are put together to determine equilibrium price and equilibrium quantity What if the price increases to $4? P Supply Schedule Demand Schedule S $5 4 3 2 1 D o Q 10 20 30 40 50 60 70 80 32
At $4, there is disequilibrium. The quantity demanded is less than quantity supplied. P Supply Schedule Demand Schedule S $5 4 3 2 1 Surplus (Qd<Qs) How much is the surplus at $4? Answer: 20 D o Q 10 20 30 40 50 60 70 80 33
How much is the surplus if the price is $5? What if the price decreases to $2? P Supply Schedule Demand Schedule S $5 4 3 2 1 Answer: 40 D o Q 10 20 30 40 50 60 70 80 34
At $2, there is disequilibrium. The quantity demanded is greater than quantity supplied. P Supply Schedule Demand Schedule S $5 4 3 2 1 How much is the shortage at $2? Answer: 30 Shortage (Qd>Qs) D o Q 10 20 30 40 50 60 70 80 35
How much is the shortage if the price is $1? P Supply Schedule Demand Schedule S $5 4 3 2 1 Answer: 70 D o Q 10 20 30 40 50 60 70 80 36
The FREE MARKET system automatically pushes the price toward equilibrium. P Supply Schedule Demand Schedule S $5 4 3 2 1 When there is a surplus, producers lower prices When there is a shortage, producers raise prices D o Q 10 20 30 40 50 60 70 80 37
Supply and Demand Analysis • Easy as 1, 2, 3 • Before the change: • Draw supply and demand • Label original equilibrium price and quantity • The change: • Did it affect supply or demand first? • Which determinant caused the shift? • Draw increase or decrease • After change: • Label new equilibrium? • What happens to Price? (increase or decrease) • What happens to Quantity?(increase or decrease) • Let’s Practice! 39
S&D Analysis Practice Analyze Hamburgers Price of sushi (a substitute) increases New grilling technology cuts production time in half Price of burgers falls from $3 to $1. Price for ground beef triples Human fingers found in multiple burger restaurants. • Before Change (Draw equilibrium) • The Change (S or D, Identify Shifter) • After Change (Price and Quantity After) 40
Double Shifts • Suppose the demand for sports cars fell at the same time as production technology improved. • Use S&D Analysis to show what will happen to PRICE and QUANTITY. • If TWO curves shift at the same time, EITHER price or quantity will be indeterminant. 41
Voluntary Exchange Terms Consumer Surplus is the difference between what you are willing to pay and what you actually pay. CS = Buyer’s Maximum – Price Producer’s Surplus is the difference between the price the seller received and how much they were willing to sell it for. PS = Price – Seller’s Minimum 42
Consumer and Producer’s Surplus • Calculate the area of: • Consumer Surplus • Producer Surplus • Total Surplus P $10 8 6 $5 4 2 1 S CS • CS= $25 • PS= $20 • Total= $45 PS D 2 4 6 8 10 Q 43
Government Involvement #1-Price Controls: Floors and Ceilings#2-Import Quotas#3-Subsidies#4-Excise Taxes 45
#1-PRICE CONTROLS Who likes the idea of having a price ceiling on gas so prices will never go over $1 per gallon? 46
Price Ceiling Maximum legal price a seller can charge for a product. Goal: Make affordable by keeping price from reaching Eq. To have an effect, a price ceiling must be below equilibrium P Gasoline S $5 4 3 2 1 Does this policy help consumers? Result: BLACK MARKETS Price Ceiling Shortage (Qd>Qs) D o Q 10 20 30 40 50 60 70 80 47
Price Floor Minimum legal price a seller can sell a product. Goal: Keep price high by keeping price from falling to Eq. To have an effect, a price floor must be above equilibrium P Corn S $ 4 3 2 1 Surplus (Qd<Qs) Price Floor Does this policy help corn producers? D o Q 10 20 30 40 50 60 70 80 48
Practice Questions 1. Which of the following will occur if a legal price floor is placed on a good below its free market equilibrium? • Surpluses will develop • Shortages will develop • Underground markets will develop • The equilibrium price will ration the good • The quantity sold will increase 2. Which of the following statements about price control is true? A. A price ceiling causes a shortage if the ceiling price is above the equilibrium price B. A price floor causes a surplus if the price floor is below the equilibrium price C. Price ceilings and price floors result in a misallocation of resources D. Price floors above equilibrium cause a shortage 49
Are Price Controls Good or Bad? To be “efficient” a market must maximize consumers and producers surplus P S CS Pc PS D 50 Qe Q