
Abstract
Figure 21: A prepared slide for human sperm with kinked tail. Figure 18: A prepared slide for human sperm with coiled tail. Figure 19: A prepared slide for human sperm with short tail. NAaseI Hypersensitivity Site Assay. Figure 20: A prepared slide for human sperm with double tail.

Abstract
E N D
Presentation Transcript
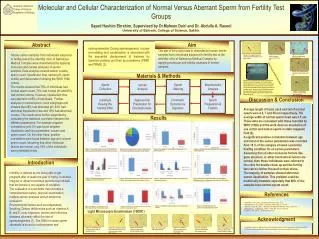
Figure 21: A prepared slide for human sperm with kinked tail. Figure 18: A prepared slide for human sperm with coiled tail. Figure 19: A prepared slide for human sperm with short tail. NAaseI Hypersensitivity Site Assay Figure 20: A prepared slide for human sperm with double tail. Molecular and Cellular Characterization of Normal Versus Aberrant Sperm from Fertility Test Groups Sayed Hashim Ebrahim, Supervised by Dr.Maheen Dairi and Dr. Abdulla A. Rasool University of Bahrain, College of Science, Sakhir. University of Bahrain College of Science Department of Biology Aim Abstract nucleoprotamine) During spermiogenesis, nuclear re-modeling and condensation is associated with the sequential displacement of histones by transition proteins and then by protamines (PRM1 and PRM2) (2). The aim of the project was to characterize human semen samples from individuals subjected to fertility test at the infertility clinic of Salmaniya Medical Complex by applying molecular and cellular analyses of semen samples. Human semen samples from individuals subjected to fertility test at the infertility clinic of Salmaniya Medical Complex were characterized by applying molecular and cellular analyses of semen samples. Data analysis covered semen volume, sperm count, liquefaction time, semen pH, sperm motility and deformation following the WHO 1992 criteria. The results showed that 79% of individuals had normal sperm count, 74% had normal pH and 85% had normal volume. However, liquefaction time was aberrant in 65% of individuals. Further analysis on normal sperm count subgroups and showed that 26% had abnormal pH, 62% had abnormal liquefaction time and 16% had abnormal volume. The results were further supported by calculating the statistical correlation between the different parameters. For example negative correlations (p=0.01) was found between liquefaction and two parameters: volume and sperm count. On the other hand, positive correlations were found between age and volume\ sperm count. Assuming that other molecular factors are normal, only 18% of the individuals were potentially fertile. Figure 20: A prepared slide for human sperm with absence mid piece region. Materials & Methods Figure 22: Gel electrophoresis photo represents the digestion reaction of samples 3 & 6 using DNaseI partial digestion. Lanes 1–3 and lanes 4–6 represents sperm samples 3 & 6, respectively. The two samples were treated with DNaseI partial digestion as shown in the table below. Top arrow show intact DNA whereas the bottom arrow points at a band generated after digestion with DNaseI. note that the migration of all bands are similar. Morphometric Analysis Sperm Collection Sperm Staining Semen Analysis Loading & Viewing the Stained DNA Chromatin Extraction & Digestion Agarose Gel Preparation for Electrophoresis Sperm Preparation & Fixation Discussion & Conclusion Average length of head, neck and tail of normal sperm were 4.5, 7 and 45 um respectively. The average width of normal sperm head was 2.5 um. These data are consistent with those reported by WHO (1992) and the work done on orientation of sea urchin and human sperm in static magnetic field (3). A significant positive correlation between age and most of the semen parameters was recorded. Also 18 % of the samples showed a potential healthy condition for all semen parameters. Assuming that all other molecular factors like, gene structure, or other biochemical factors are normal, then these individuals were referred to the clinic for double check up and the fertility test can be further focused on their wives. The majority of samples showed abnormal semen liquefaction. This problem could be medicinally treatable especially that 80% of the samples have normal sperm count. Results Figure 3: Percentage of individuals with Normal pH = 7-8; Abnormal pH > 8. Figure 4: Relationship between sperm count subgroups and liquefaction time. Figure 1: Percentage of sperm count. Of Normal (20-50 million sperm/ml) and Abnormal (<20 million sperm/ml). Figure 2: Percentage of sperm count of Oligospermic (< 20 million sperm/ml) & Azoospermic (no sperm). Introduction Infertility is defined as not being able to get pregnant after at least one year of trying. In women, irregular or absent menstrual periods may indicate that the female is not capable of ovulation. The evaluation of a subfertile man includes a comprehensive history, physical examination, multiple semen analyses and an endocrine evaluation. Environmental factors such as temperature, Smoking, Dietary deficiencies such as vitamins A, B, and E, x-ray exposure, alcohol and infectious diseases adversely affect the rate of spermatogenesis (1). The DNA in human sperm chromatin is bound to nucleohistone and Figure 5: Relationship between sperm count subgroups and liquefaction time. Figure 6: Percentage analysis of individuals with normal (1.5-5ml) & abnormal seminal fluid volume (<1.5 ml). Figure 7: Relationship between sperm count subgroups & seminal fluid volume. Figure 8: Analysis of sperm deformation in total samples. Deformation is the % measurement of defects (< 60% normal sperm) in tail, head, & neck. References 1Watanabe T.,et al. (2007). J.Congenital Anomalies. 47(1): 9-15. 2Esmaeilzadeh S., et al. (2007).J. Reprod.& infertility. 22( 11): 133-140. 3Sakhnini L & Dairi M. (2007). J. Magnetism and Magnetic Materials. 310(2): 1035-1037. 4Balakrishnan, L., & Milavetz B., (2007). J. Mole. Biol. 371(4): 1022-1037. 5Levitas E., et al. (2007). J. Andrlogia. 39(2):45-50 Figure 11: Relationship between sperm count subgroups and pH Figure 12: Relationship between sperm count subgroups and volume Figure 10: Analysis of seminal fluid pH in individuals with the normal sperm count. Figure 9: Analysis of liquefaction time in individuals with the normal sperm count. Light Microscopic Examination (1000X ) Acknowledgment I would like to thank Dr. Maheen Dairi and Dr. Abdulla A.Rasool for their supervision, the technical staff at UOB for laboratory assistance and Salmanya Hospital for providing samples from patients. Figure 15: A prepared slide for human sperm with an elongated head. Figure 17: A prepared slide for human sperm with double head abnormality. Figure 13: A prepared slide for human sperm with an amorphous head Figure 14: A prepared slide for abnormal human sperm with very small size of head (Microsperm). Figure 18: A prepared slide for human sperm with rounded head. Figure 16: Human sperm with a tapered head. Figure 19: A prepared slide for human sperm with Kinked mid piece region.


