Download
1 / 6
60 likes | 169 Vues
This project aims to design and assemble a test rig capable of acquiring quantitative data using both Doppler Ultrasound and Particle Image Velocimetry (PIV) systems. The primary purpose of this rig is to provide a benchmark for improving the Doppler Ultrasound tracking algorithm and support Allan Andranikian's thesis defense. Key stakeholders include Allan Andranikian, Dr. Steven W. Day, and Dr. Ronald Schwartz. The test stand must accommodate various visualization sections for fluid flow analysis, presenting outputs from both systems in a user-friendly interface.

E N D
Doppler Ultrasound Test StandBackground Information and Voice of the Customer Allan Andranikian
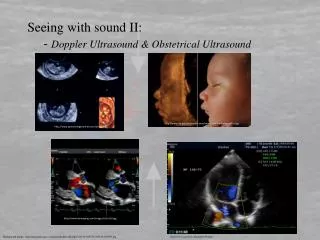
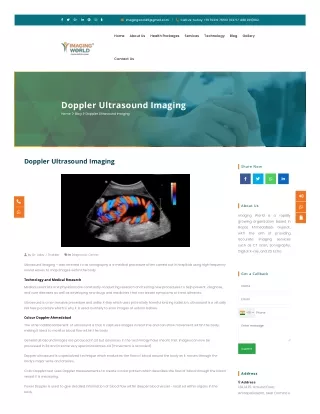
Background Information • Doppler Ultrasound Visualization is currently the only non intrusive method in existence that can acquire velocity profiles for internal flows without the use of a clear optical section. • Used exclusively for medicinal purposes by echocardiologists to make estimates for systolic pressure. • Due to the delicate nature of the calibration required by these devices and the current particle tracking algorithm employed, velocity readings are often inaccurate
Goals • The primary goal of this project is to design, assemble, and acquire quantitative data via a test rig that can accommodate both a Doppler Ultrasound dive, and a Particle Image Velocimetry system. • The data will serve two uses: provide a benchmark for possible improvement in the Doppler Ultrasound tracking algorithm or touch-probe, and be utilized in Allan’s thesis defense.
Key Stakeholders • Primary Stakeholders: • Allan Andranikian (BSMS Student) • Dr. Steven W. Day (Professor, KGCOE) • Secondary Stakeholders: • Dr. Ronald Schwartz (Cardiologist at Strong Memorial) • Dr. SatishKandlikar (Thesis Committee, tentative)
Customer Requirements • Test stand must be able to perform both PIV and Doppler Ultrasound Acquisition (not simultaneously). • Test stand must incorporate a user interface which can read outputs from both imaging systems, and analyze and display them in a similar fashion. • The design team must design, and incorporate several different “visualization sections” which will be the focus of both systems. • The visualizations sections should be easily interchangeable, and should have different effects on fluid flow. • All experimental data should be compared to analytical data acquired computationally.