Analyzing Pulsating X-Ray Sources: White Dwarfs in Globular Clusters and Accreting Systems
This analysis explores two pulsating X-ray sources: white dwarfs located in globular clusters and the unique characteristics of systems like Cen X-3 and GK Per. Utilizing data from Hubble images, Chandra spectroscopy, and DS9 tools, we examine energy arrival times, light curves, and power spectra to identify periodic X-ray emissions. By comparing these findings to historical light curves and established standards, we aim to deepen our understanding of accreting white dwarfs and the dynamics of pulsar systems, contributing to our broader knowledge of stellar evolution.

Analyzing Pulsating X-Ray Sources: White Dwarfs in Globular Clusters and Accreting Systems
E N D
Presentation Transcript
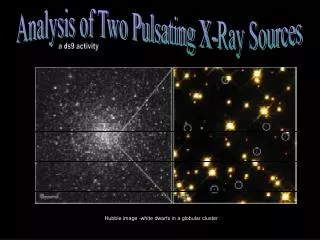
Analysis of Two Pulsating X-Ray Sources a ds9 activity Hubble image -white dwarfs in a globular cluster
What is it? And how do we know? Cas A
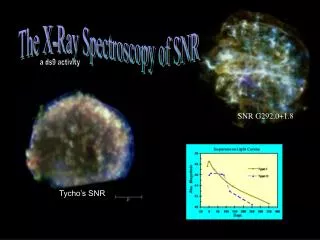
And these are? Cen X3 GK Per Go to Analysis>Virtual Observatory and check any of the servers. From the new window that appears, click Obs ID 1943 – THE WIND AND ACCRETION DISK IN CEN X-3/V779 CEN. Choose Frame>Tile Frames and Frame>New Frame Click the back button on the server window and click Obs ID 3454 -CHANDRA HETG SPECTROSCOPY OF GK PER IN OUTBURST
Craft Schematic X-Ray Imaging and X-Ray Data: The Data Consists of: Energy Time of Arrival – discrete – usually 3.24s in duration Position
We can compare light curves of unknown objects to standard light curves made of objects such as: eclipsing binaries and supernovae.
Light Curves Regular or irregular variation?
Zoom! Zoom in on an area on the graph by either left clicking and dragging a box around a region of the graph until you can determine if there appears to be a periodic x-ray pulse.
Power Spectra Go to Analysis>Chandra Ed Analysis Tools>FTOOLS Power Spectrum and click OK. The power spectrum plots the likelihood that a frequency is present in the data (represented by "power" on the vertical axis) as a function of frequency (on the horizontal axis).
Accreting white dwarf Hot spots! Accretion powered pulsar
Find the period of rotation Zoom of Power Spectrum of GK Per 1 period = frequency Zoom of Power Spectrum of Cen X-3
How fast can a star spin without blowing apart? Msun = 2.0 X 1030 kg Comparison of a White Dwarf Star and the Earth. Comparison of a Neutron Star and the Island of Manhattan.