Download
1 / 24
240 likes | 409 Vues
WRIA 8 Fish in/Fish out Monitoring Summary. Presentation to the WRIA 8 Salmon Recovery Council. Hans B. Berge King County Department of Natural Resources and Parks Water and Land Resources Division. 17 November 2011. Background.

E N D
WRIA 8 Fish in/Fish out Monitoring Summary Presentation to the WRIA 8 Salmon Recovery Council Hans B. Berge King County Department of Natural Resources and Parks Water and Land Resources Division 17 November 2011
Background • Chinook listed as threatened under ESA in 1999 in Puget Sound ESU • Science-based conservation plan for WRIA 8 adopted by NOAA in 2005 • Conservation Plan strongly endorses monitoring using VSP parameters to identify goals and objectives, and to measure effectiveness of plan implementation (this project)
Viable Salmonid Population(VSP) Interdependent parameters for evaluating viability: Abundance • How many fish are there at various life stages? Productivity • Is the population growing? Distribution (spatial structure) • Don't put all your fish in one stream Diversity • How many life history strategies are present? Measures of genetic diversity
1.4 M people • Ocean-type, Fall Chinook threatened in 1999 • 2 Chinook hatcheries (~2.5 M per year) • Mass marking began in 1999 (>95%) • Land use includes urban, ag, rural res, forest
Methods • Timing and Abundance • Biological characteristics • Productivity • Diversity
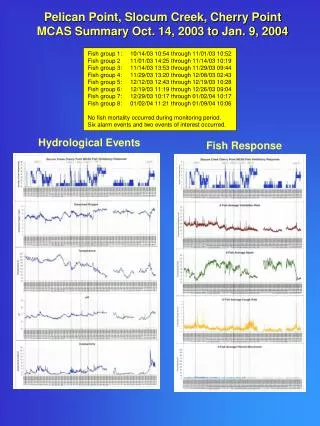
Timing and Abundance • Live counts 1x per week in all streams with Chinook • Live and Dead counts • Carcass sampling • Redd Identification and location (2-3x per week) • Analysis • Area-under-the-curve (AUC) • Redd counts (2.5 fish/redd) to reduce error • Redd density (GPS location)
Chinook Sockeye Live Counts Redds
Adipose Fin Presence of Hatchery Fish on Spawning Grounds Photos from NMT website: http://www.nmt-inc.com
Productivity • Potential egg deposition (#redds x fecundity) • based on age information • Migrants (scoop and rotary screw traps at mouth of Cedar River and Bear Creek) • PIT Tagging at screw trap and interrogated at Locks • Returning adults (unmarked component of appropriate age)
Pre-Spawning Mortality Marked females have a higher incidence of PSM in each basin (chi sq; P<.001) 7.7% vs. 22.2% of marked females
CWT Results • Hatchery strays from: • Kitsap Peninsula (Gorst Ck, Grovers Ck) • Cowlitz River Hatchery • Tulalip Bay • University of Washington • Issaquah Creek (majority) • Elliott Bay Net pen releases • Soos Creek
Productivity • What does it mean? • Survival from life stage to life stage • Full life cycle survival (redd to redd) • Population replacement (redd to redd ratio >1.0)
Juvenile Survival Cedar River Jan-April small fry (45mm) migration with later (May-June) larger parr (60-100mm) migration
Cedar River Redd to Redd Recovery plan goal Replacement
Benefits • Improved knowledge of species • Monitoring data used to focus actions in the plan • Auditing of restoration projects • Rearing capacity limiting in the Cedar River for smolt production • Pooling resources across jurisdictions for shared benefits • In-kind contributions increasing each year for projects • Collaboration and training with the Cedar River Naturalists, SalmonWatchers, Water Tenders, and Salmon Seeson • Raising awareness in the public by providing accurate information • Observation of in season problems for salmon • Blockages/beaver dams, fish kills, etc. • Interaction and educational opportunities with private property owners • Removing pumps from streams, landscaping, agency contact information
Importance for Stakeholders • Chinook life history requires consistent long-term annual monitoring to understand status and trends in population dynamics in order to compare to goals for recovery • Predictive relationships between fish in and fish out data will help devise possible future management actions • Understanding how projects relate to productivity is essential for de-listing species
Acknowledgments • WRIA 8 Technical Committee and Salmon Recovery Council • Spawning ground surveyors: mix of State, County, and Tribal staff • Karl Burton, SPU, redd surveys in the Cedar River • John Sneva et. al, WDFW, for aging scales • City of Redmond, Boeing, Blockbuster Video for help with Screw trap access and power Funding provided by the King Conservation District