
Phylogenetic Analysis and Expression Patterns of Rice Gene OsIRX10 and Its Homologs
This study explores the phylogenetic relationships and expression patterns of the rice gene OsIRX10 and its homologs, including IRX10 and FRA8 from Arabidopsis. Phylogenetic trees built from sequences reveal evolutionary connections, while qRT-PCR analyses show relative expression in various rice tissues at different developmental stages. The presence of a transposon insertion in the mutant line RGT6229D affects OsIRX10 expression and morphology, highlighting its role in secondary wall development. This research integrates genetic and morphological data to better understand xylan biosynthesis.

Phylogenetic Analysis and Expression Patterns of Rice Gene OsIRX10 and Its Homologs
E N D
Presentation Transcript
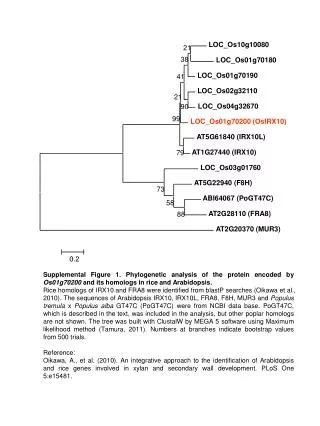
LOC_Os10g10080 21 38 LOC_Os01g70180 LOC_Os01g70190 41 LOC_Os02g32110 21 LOC_Os04g32670 90 99 LOC_Os01g70200 (OsIRX10) AT5G61840 (IRX10L) AT1G27440 (IRX10) 79 LOC_Os03g01760 AT5G22940 (F8H) 73 ABI64067 (PoGT47C) 58 AT2G28110 (FRA8) 88 AT2G20370 (MUR3) 0.2 B Supplemental Figure 1. Phylogenetic analysis of the protein encoded by Os01g70200 and its homologs in rice and Arabidopsis. Rice homologs of IRX10 and FRA8 were identified from blastP searches (Oikawa et al., 2010). The sequences of Arabidopsis IRX10, IRX10L, FRA8, F8H, MUR3 and Populus tremula x Populus alba GT47C (PoGT47C) were from NCBI data base. PoGT47C, which is described in the text, was included in the analysis, but other poplar homologs are not shown. The tree was built with ClustalW by MEGA 5 software using Maximum likelihood method (Tamura, 2011). Numbers at branches indicate bootstrap values from 500 trials. Reference: Oikawa, A., et al. (2010). An integrative approach to the identification of Arabidopsis and rice genes involved in xylan and secondary wall development. PLoS One 5:e15481.
0.25 0.2 0.15 0.1 0.05 0 Relative Expression of OsIRX10 55 dpg, nodes 20 dpg, leaves 100 dpg, leaves 55 dpg, upper old culms 34 dpg, leaves and sheath 55 dpg, lower new culms 100 dpg, seeds no embryo 34 dpg, young node and culms 55 dpg, lower leaves and sheath 20 dpg, leaves, sheath and culms Supplemental Figure 2. Expression pattern of Os01g70200. The data were derived from the means of qRT-PCR experiments with biological triplicates that were measured with technical duplicates. The results obtained for the different tissues were normalized to the ubiquitin 10 gene expression. Error bars indicate standard deviations. Age of plants from which the RNA samples were collected is indicated in days post germination (dpg).
1 kb Plant height (cm) 1 2 3 4 5 1 2 NPB RGT6229D Gus 120 CK 100 80 2F/3R 60 CK 100 40 1 2 3 4 5 1 2 90 20 80 RGT6229D NPB 70 0 NPB Osirx10 60 50 40 30 20 10 0 A C 2F 3R RGT6229D B D OsIRX10 expression Supplemental Figure 3. Characterization of the rice transposon insert mutant, RGT6229D. (A) Schematic structure and transcript analysis of the locus OsIRX10. Exons (indicated with solid boxes), introns (indicated with lines), 5’ and 3’ untranslated regions (indicated with open boxes), and the transposon insertion site (indicated with blank triangle) are shown. The positions of the primers (indicated with arrows) used for PCR-based genotyping and RT-PCR-based transcription analysis are shown. (B) PCR-based genotyping on the five individual plants developed from the transposon insertion mutant line RGT6229D and two wild type NPB plants. Gus linker and CK (a DNA fragment of Xb24 gene (Chen et al., 2010)) were amplified by primer pairs Gus-F/Gus-R, and Xb24-F/Xb24-R, respectively. (C) Plant height of the five individual plants developed from the transposon insertion mutant line RGT6229D and two wild type NPB plants. Measurement of plants height was performed at maturity. (D) Comparative qRT-PCR analyses of the OsIRX10 gene transcription between the mutant Osirx10 (RGT6229D-4) and wild-type NPB. Reference: Chen, X., Chern, M., Canlas, P.E., Ruan, D., Jiang, C., and Ronald, P.C. (2010). An ATPase promotes autophosphorylation of the pattern recognition receptor XA21 and inhibits XA21-mediated immunity. Proc Natl Acad Sci U S A 107:8029-8034.
1 2 3 4 5 6 B A C W M W M W M W M W M W M W M W M young plants Mature plants Supplemental Figure 4. Morphology of the mutant RTG6229D-4 (Osirx10). Wild-type OsIRX10 and the mutant Osirx10 from the youngplants (A) and mature plants (B), respectively. (C) six longest tillers from OsIRX10 and the mutant Osirx10. W, the wild type OsIRX10; M, the mutant Osirx10. The scale bars in (A), (B) and (C) represent 5 cM, respectively.
0.3 0.25 0.2 0.15 0.1 0.05 0 NPB Osirx10 OsIRX10 2 1.5 1 0.5 0 NPB Osirx10 OsIRX10 B A B ** ** Secondary cell wall thickness (µm ) Primary cell wall thickness (µm ) Supplementary Figure 5. Cell wall thickness in the wild type NPB, the mutant Osirx10 and OsIRX10. Cell wall thickness was measured under scanning electron microscope (12000X). Twenty sclerenchyma cells from the wild type NPB, the mutant Osirx10 and OsIRX10, respectively, were measured. (A) The primary cell wall thickness. (B) The secondary cell wall thickness. Error bars indicate standard error. “**” indicates that the difference in the cell wall thickness between the mutant Osirx10 and wild type NPB or OsIRX10 is highly significant (p < 0.001, n=30, One-way ANOVA analysis).
140 * 120 100 80 60 40 20 0 B A B 120 * 100 80 Vascular bundle diameter (µM) Vascular bundle length (µM) 60 40 20 0 NPB Osirx10 OsIRX10 NPB Osirx10 OsIRX10 Supplementary Figure 6. Vascular bundle size in the wild type NPB, the mutant Osirx10 and OsIRX10. Vascular bundle size (tangential and radial cross-section) was measured under light microscope (Figure. 2). Thirteen vascular bundles from the wild type NPB, the mutant Osirx10 and OsIRX10, respectively, were measured. (A) The tangential measurement. (B) The radial measurement. Error bars indicate standard error. “*” indicates that the difference in the vascular bundle size between the mutant Osirx10 and wild type NPB or OsIRX10 is highly significant (p < 0.05, n=25, One-way ANOVA analysis).
* Supplementary Figure 7. Monosaccharide composition of cell walls of the mutant, Osirx10. Destarched AIR was prepared from first internode (top) plus the panicle culm. Monosaccharide composition was determined after TFA hydrolysis for the mutant, Osirx10 and the wild type, NPB. Error bars indicate SE (n=4), “*” indicates the difference is significant (P < 0.01, Student’s t-test).
Transgenic OsIRX10 Transgenic OsIRX10 Osirx10 Osirx10 NPB NPB Supplementary Figure 8. Complementation of the Osirx10 mutant with OsIRX10 driven by its native promoter. Representative plants from the wild-type NPB, the mutant Osirx10, and the transgenic plants carrying OsIRX10 (transgenic OsIRX10). Left panel, Plants with leaves; right panel, Same plants with leaves removed. Scare bars represent 10 cM.
Supplementary Figure 9. Size-exclusion chromatography profiles of wild type and mutant polysaccharides. Fractions soluble in 1 M KOH prepared from the wild type NPB (A) and the mutant Osirx10 (B) were respectively analyzed by size exclusion chromatography. The elution times of calculated pollulan molecular weights are shown.