Download
1 / 1
10 likes | 124 Vues
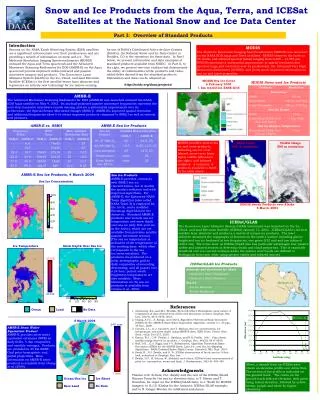
This document discusses the progress in automated snow and ice mapping utilizing data from the Geostationary Operational Environmental Satellites (GOES). It highlights the significance of snow cover distribution in weather prediction and hydrological models. The poster outlines the developments in automated techniques designed to enhance the accuracy and spatial resolution of snow mapping compared to past methods. Furthermore, it explores the role of the GOES-R Advanced Baseline Imager (ABI) in improving snow detection, particularly in complex environments like forests and snowy regions.

E N D
Yes T4 < 230 K No SI > SIT and R1 > R1T and R2 < 5% and T4 < 290K Yes No GOES-9 Yes T4<265K Colorado No Snow Cloud Yes T4>285K Texas No Yes R1>25% or R2>10% No New Mexico Colorado Texas Land New Mexico Feb 25, 2004 Feb 25, 2004 Mar, 14 GOES Snow mapping scheme Mar, 16 Automated snow-mapping with GOES Imager Using Meteosat-8 (MSG) SEVIRI as GOES-R ABI prototype Mar, 18 Mar, 20 Mar, 22 Mar, 24 SI=R1/R3: snow index R1: visible reflectance (0.6 m) R2: middle infrared reflectance (3.9 m) T4: infrared brightness temperature (10.7 m) R1T and SIT are location dependent MAPPING SNOW AND ICE FROM GEOSTATIONARY SATELLITES: GETTING READY FOR GOES-R Peter Romanov1,2 and Dan Tarpley1 1Office of Research and Applications, NOAA/NESDIS 2Cooperative Institute for Climate Studies, University of Maryland e-mail: peter.romanov@noaa.gov, www: http://www.orbit.nesdis.noaa.gov/smcd/emb/snow/HTML/snow.htm Background Getting ready for GOES-R Daily GOES-based snow cover products Snow cover distribution and snow cover properties (particularly, snow cover fraction, depth and SWE) are critical boundary conditions for numerical weather prediction and hydrological models. Snow cover and snow pack properties are important for climate and for various environmental studies. Since 1966 NESDIS has produced interactive maps of snow cover over the Northern Hemisphere. However, the increasing demand of the modeling community for higher spatial and temporal resolution of information on the snow cover has stimulated development of automated satellite-based techniques for snow mapping and monitoring. These techniques were initially intended and are now used to complement the interactive product and to facilitate the work of a human analyst, but eventually are expected to replace the interactive technique. Observations from the Imager instrument onboard Geostationary Operational Environmental Satellites (GOES) are among major sources of data utilized by NESDIS analysts when generating interactive snow and ice cover maps. This poster presents the progress in automated snow and ice mapping with GOES data. Perspectives for using the GOES-R Advanced Baseline Imager (ABI) to improve snow and ice maps are discussed. North America snow/ice maps from combined GOES-E and GOES-W data Far East snow maps from GOES-Pacific (GOES-9) • Improvements are expected owing to • (1) Larger selection of spectral channels, particularly • Near-Infrared (0.88μm): better detection of snow in forests • Shortwave infrared (1.6μm): better snow-cloud discrimination than with 3.9 μm channel. • Split window channels: a more accurate estimation of the land surface temperature Daily RGB composite Red: R2 (MidIR); Green:R1(vis); Blue: T4 (IR) Feb 21, 2005 Feb 24, 2004 RGB composite Red: R2 (MidIR), Green: R1(vis), Blue: T4 (IR); Snow-covered surfaces appear in green and dark green Snow/ice map Green: land, White: snow, Blue: water Yellow: ice, Gray: clouds Snow map Green: land White: snow Blue: water Gray: clouds Surface observations: Red: non-zero snow depth Yellow: no snow on the ground Snow in New Mexico Location of ground-based stations used for snow map validation Basics of snow detection in vis/mid-IR/IR With 16 channels the accuracy of snow/ice mapping with GOES-R ABI should be similar to the accuracy of snow/ice mapping with MODIS onboard Terra and Aqua satellites. Left: RGB composite Right: Snow map Feb 21, 2005 Feb 24, 2004 Physical basis - Specific spectral signature of snow, high reflectance in the visible (vis) and low reflectance in the middle-infrared (Mid-IR), which is different from spectral reflectance of most other natural surfaces. - Observations in the infrared (IR) are used to assess the surface temperature and to separate the reflected component in the Mid-IR outgoing radiance. Known limitations - Day-time only method - Clouds obscure the scene - Dense forests mask snow cover Errors of snow mapping with GOEs Imager and MODIS Terra estimated through comparison with ground-based data. Forest cover categoriesare (1): Below 20% tree cover*, (2)2: From 20% to 50% tree cover, (3). Over 50% tree cover North America blended snow/ice maps Focus on Great Lakes Snow cover over South America Blending is performed by filling in cloudy pixels in the current day snow map with the most recent cloud-clear retrievals GOES-based blended daily snow maps. Year 2000 snow season • (2) On-board calibration of shortwave channels • Will enhance potentials for detecting long-term trends in the snow extent Russia Five percent of unaccounted sensitivity loss of the visible sensor, causes up to 3% error in the total mapped snow extent. For comparison, the average rate of decrease of the snow cover extent over North America in the last 30 years was about 0.25%/year. The average year-to-year variation in the total snow extent was 4.2%. Mongolia China Green: land, White: snow, Blue: water, Gray: clouds Yellow: ice, Red: broken ice Spectral reflectance of natural surfaces. Accuracy of snow maps: The agreement between GOES-based automated snow maps and ground-based snow cover observations ranges from 92% to 95% depending on the season, the land surface cover type and the snow depth. Russia Duration of the snow season Decrease of the mapped snow cover area (in percent, left and in square km, right) due to an unaccounted sensitivity loss of the visible sensor. GOES data over North America. Estimates are made for the 2000-2001 winter season Mongolia Snow mapping algorithm Other snow products • Utilizes observations in the vis (0.6μm), Mid-IR (3.9 μm) and IR (11.5 μm) spectral bands • Makes maximum use of frequent observations available from GOES • Ice cover mapping was added in 2004. The algorithm is similar to the one for snow (3) Higher spatial resolution - Will improve ability to reproduce small-scale variability in the snow cover/snow depth distribution Highly desired: (4) Improvement in the navigation and registration of the image data. With current errors of registration between repeated images of up to 6 km within 24 hours, max temperature image compositing causes the “loss” of some snow along the snow line. Snow cover fraction Snow cover temperature Required in estimates of albedo of snow covered areas Helps to identify areas of snow melt. • - Derived from Ch.1 (visible) reflectance • - Sub-pixel snow fraction • Linear mixture approach • F = (Robs - Rland) / (Rsnow- Rland) • 10% accuracy (estimated) Details • Daily image compositing: helps to reduce cloud contamination - Observations with maximum IR brightness temperature (T4) are retained (“max temperature” compositing) • Snow Identification - Threshold-based decision-tree algorithm (see picture on the right) - Retrievals are checked against the land surface temperature climate data and snow cover climatology • Temporal stability test - Looks for observations, that are spectrally similar to the “max temperature” observation • - Observations are spectrally similar if ΔT4 < 10K, ΔR1 < 5% and ΔR2 < 1.5% • - Three spectrally similar observations are needed to flag the pixel as “confirmed snow” Daily snow fraction map Max snow fraction is strongly correlated with the tree cover fraction (R=0.79), Spinning Enhanced Visible and Infrared Imager (SEVIRI) data from MSG satellite can be used for testing a snow and ice mapping algorithm for GOES-R ABI. SEVIRI makes observations in all spectral bands that will be utilized for mapping snow and ice from GOES-R, i.e, visible, near IR, shortwave IR, Mid IR and far IR. MSG SEVIRI spectral bands: No. λ(μm) 1 0.635 (*) 2 0.81 (*) 3 1.64 (*) 4 3.90 (*) 5 6.25 6 7.35 7 8.70 8 9.66 9 10.80 (*) 10 12.00 (*) 11 13.40 12 VIS (*) Used in snow/ice mapping Snow cover distribution derived from MSG data with an automated algorithm agrees well to NOAA interactive snow cover analysis data (IMS system). Tree cover fraction (UMd data) for areas affected by frequent seasonal snow Spring-time snow melt in Quebec Max snow fraction for areas affected by seasonal snow. Multiyear composited image Snow depth Model: D = exp (aF+b) -1, where a and b are 3rd degree polynomials of the forest fraction, D is the snow depth, F is snow fraction MSG (automated) IMS (interactive) Snow depth vs snow fraction for different forest cover fraction. Deciduous forest. GOES Snow identification Over non-forested and sparsely forested areas the snow fraction is mostly controlled by grass protrusions through the snow pack and therefore is closely related to the snow depth. Correlation between snow fraction and snow depth is also observed over moderately forested areas (up to 50-80% forest cover fraction). The relationship between snow depth and snow fraction was established from matched surface and satellite observations. The accuracy of snow depth estimates is about 30%. Retrievals are generally limited to 30-50 cm of snow depth. Snow map features Snow depth map over Great Plains and Canadian prairies. Light gray: clouds Dark gray: forested area • Generated daily at 4 km resolution • Coverage up to 660N • Daily snow maps have gaps due to clouds MSG blended snow map: latest cloud clear observation is retained for every location Snow depth distribution. Snow depth reported from ground-based stations is shown in black Stations reporting snow depth in Great Plains area. Forest cover fraction is shown in shades green This poster is available for download at http://www.orbit.nesdis.noaa.gov/smcd/emb/snow/presentations/GOES-R_2006_poster.ppt