Download
1 / 9
90 likes | 91 Vues
The market for foundry is expected to grow at XX% between 2018 and 2023. The growth in foundry is mainly attributed to the rising demand from power electronics, high performance computing, and cryptocurrency, among others. Furthermore, increase in need for faster and efficient electronic components which consumes less power for applications in Internet of Things (IoT) is expected to drive the market for foundry during the forecast period (2018-2023).

E N D
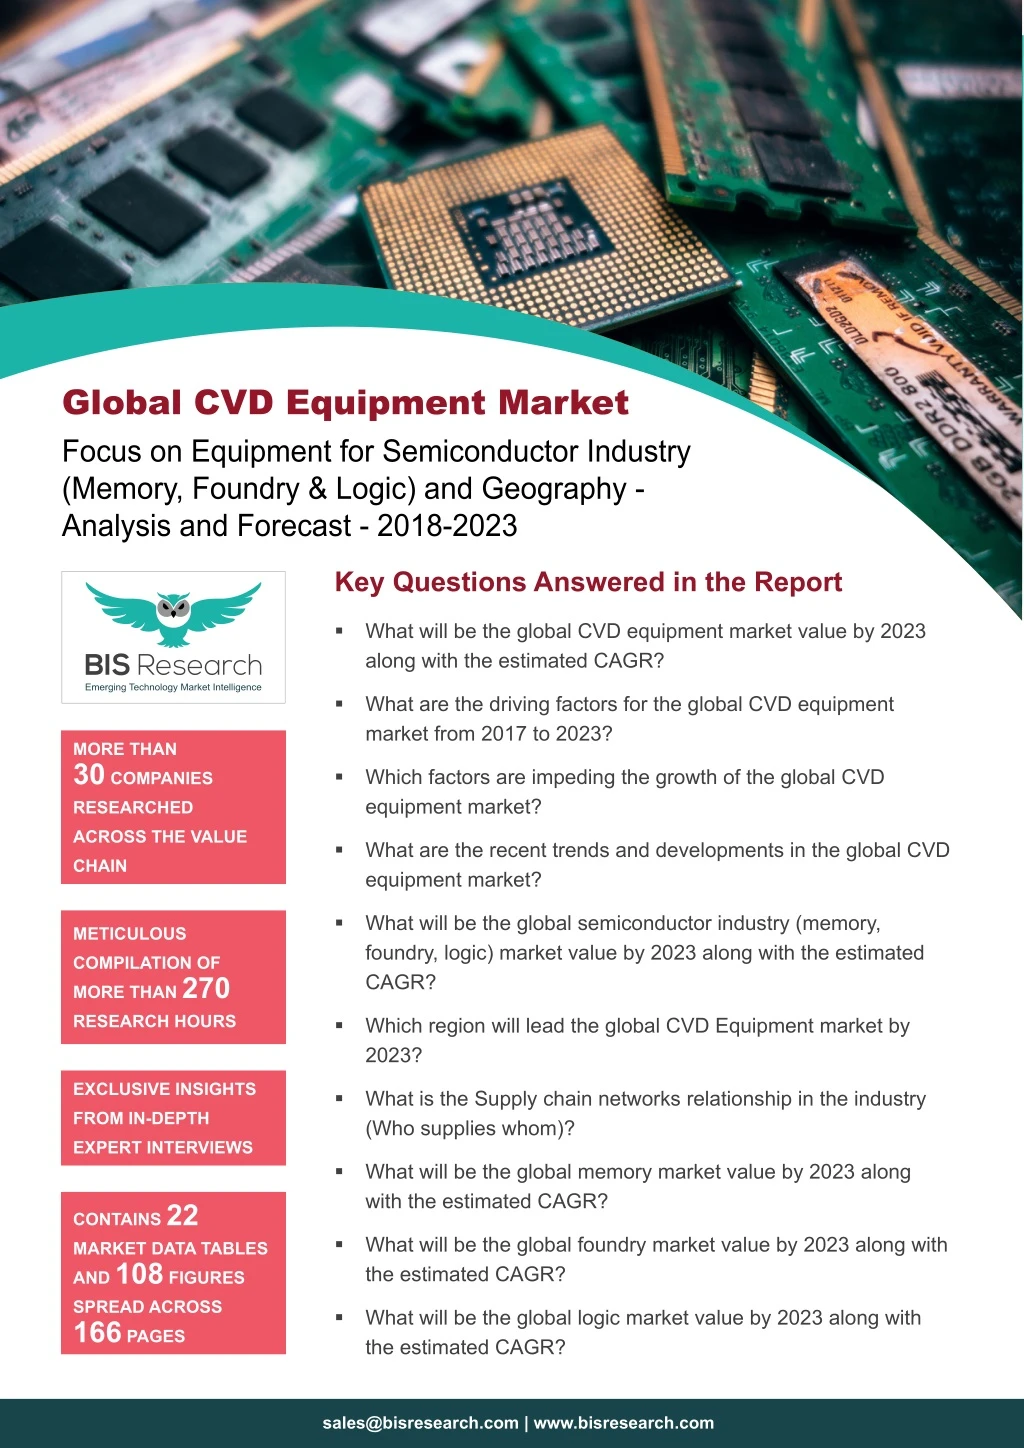
Global CVD Equipment Market Focus on Equipment for Semiconductor Industry (Memory, Foundry & Logic) and Geography - Analysis and Forecast - 2018-2023 Key Questions Answered in the Report What will be the global CVD equipment market value by 2023 along with the estimated CAGR? What are the driving factors for the global CVD equipment market from 2017 to 2023? MORE THAN 30 COMPANIES RESEARCHED Which factors are impeding the growth of the global CVD equipment market? ACROSS THE VALUE What are the recent trends and developments in the global CVD equipment market? CHAIN What will be the global semiconductor industry (memory, foundry, logic) market value by 2023 along with the estimated CAGR? METICULOUS COMPILATION OF MORE THAN 270 RESEARCH HOURS Which region will lead the global CVD Equipment market by 2023? EXCLUSIVE INSIGHTS What is the Supply chain networks relationship in the industry (Who supplies whom)? FROM IN-DEPTH EXPERT INTERVIEWS What will be the global memory market value by 2023 along with the estimated CAGR? CONTAINS 22 MARKET DATA TABLES AND 108 FIGURES SPREAD ACROSS 166 PAGES What will be the global foundry market value by 2023 along with the estimated CAGR? What will be the global logic market value by 2023 along with the estimated CAGR? sales@bisresearch.com | www.bisresearch.com
Table of Contents MARKET DYNAMICS COMPANY PROFILES Overview Lam Research Corporation Applied Materials Inc. Tokyo Electron Limited CVD Equipment Corporation IHI Corporation Plasma – Therm ASM International ULVAC Inc. Hitachi Kokusai Electric Inc. Aixtron Veeco Instruments Inc. Jusung Engineering Co. Ltd. Introduction Market Drivers Market Restraints Market Opportunities COMPETITIVE LANDSCAPE Key Strategies and Developments Market Share Analysis Industry Attractiveness Product Benchmarking Leading Player Analysis Vendor Landscape Company Market Positioning INDUSTRY ANALYSIS Patent Analysis Who Supplies Whom Value Chain Analysis REPORT SCOPE AND METHODOLOGY Scope of the Report CVD Equipment Market Research Methodology GLOBAL SEMICONDUCTOR MARKET ANALYSIS & FORECAST, 2017-2023 Assumptions & Limitations Memory Foundry Logic GLOBAL CHEMICAL VAPOUR DEPOSITION (CVD) EQUIPMENT MARKET (BY TECHNOLOGY) Overview Plasma Enhanced CVD (PECVD) Low Pressure CVD (LPCVD) Metal Organic CVD (MOCVD) Atmospheric Pressure CVD (APCVD) Others GLOBAL CHEMICAL VAPOUR DEPOSITION (CVD) EQUIPMENT MARKET (BY REGION), 2017-2023 Market Overview North America Europe Asia-Pacific Rest of the World (RoW) VIEW COMPLETE TABLE OF CONTENT sales@bisresearch.com | www.bisresearch.com
List of Tables 1. Impact Analysis of Drivers 2. New Fabrication Plants, 2016-2017 3. Impact Analysis of Restraints 4. Harmful Properties of Gases used in CVD Process 5. Key Strategies and Developments 6. Key Factors in Determining “Threat from New Entrants” in CVD equipment Market 7. Key Factors in Determining “Bargaining Power of Suppliers” in CVD Equipment Market 8. Key Factors in Determining “Bargaining Power of Buyers” in CVD Equipment Market 9. Key Factors in Determining “Threat from Substitutes” in CVD Equipment Market 10. Key Factors in Determining “Intensity of Competitive Rivalry” in CVD Equipment Market 11. Lam Research Products Offerings 12. Applied Materials Products Offerings 13. Tokyo Electron Products Offerings 14. ASMI Product Offering 15. Global Memory Market ($ Billion), by Type, 2017-2023 16. Global Foundry Market ($ Billion), by Type, 2017-2023 17. Global Logic Market ($ Billion), by Type, 2017-2023 18. Global CVD Equipment Market ($Billion), by Region, 2017-2023 19. North America CVD Equipment Market ($Billion), by Country, 2017-2023 20. Europe CVD Equipment Market ($Billion), by Country, 2017-2023 21. Asia-Pacific CVD Equipment Market ($Billion), by Country, 2017-2023 22. Rest-of-the-World CVD Equipment Market ($Billion), by Region, 2017-2023 sales@bisresearch.com | www.bisresearch.com
List of Figures 1. Global Semiconductor Market Segmentation 34. Global Pure-Play Foundry Market ($Billion), 2017-2023 2. Memory Market (by Type), 2017 35. Integrated Device Manufacturer Foundry Market 3. Foundry Market, 2017 36. Global Logic Market Segmentation 4. Global Logic Market, 2023 37. Global Logic Market ($Billion), 2017, 2018 and 2023 5. Global CVD Equipment Market, 2017 38. Global Standard Purpose Logic Market ($Billion), 2017-2023 6. Market Dynamics 7. Growing demand for IoT and AI 39. Global Special Purpose Logic Market ($Billion), 2017-2023 8. Increased Data Analysis Improving Quality of Artificial Intelligence 40. Chemical Vapor Deposition Technologies 9. Fab Investment Trend 2010-2018 41. Physical Vapor Deposition (PVD) vs Chemical Vapor Deposition (CVD) 10. Smartphone Shipments, 2012-2017 11. Autonomous Vehicles Fuelling Growth for NAND & DRAM 42. Global CVD Equipment Market, 2017 43. North America CVD Equipment Market (by Country), 2017 12. Market Share Analysis 13. Porter’s Five Forces Analysis for CVD Equipment Industry 44. North America CVD Equipment Market, 2017-2023 45. The U.S. CVD Equipment Market, 2017-2023 14. Product Benchmarking Lam Research 46. Mexico CVD Equipment Market, 2017-2023 15. Product Benchmarking Applied Materials 47. Canada CVD Equipment Market, 2017-2023 16. Product Benchmarking Tokyo Electron 48. Europe CVD Equipment Market (By Country), 2017 17. Product Benchmarking ASMI 49. Europe CVD Equipment Market, 2017-2023 18. Company Ranking Analysis, 2017 50. Germany CVD Equipment Market, 2017-2023 19. Vendor Landscape 51. The Netherlands CVD Equipment Market, 2017-2023 20. Semiconductor Equipment Market Share, 2010-2017 52. Ireland CVD Equipment Market, 2017-2023 21. Semiconductor Equipment Market Share, 2016 & 2017 53. Asia-Pacific CVD Equipment Market (by Country), 2017 22. Patent Filing Trend in CVD Equipment Industry, 2008-2018 54. China CVD Equipment Market, 2017-2023 23. Patents Filed by Companies/Organisations, 2008-2018 55. Japan CVD Equipment Market, 2017-2023 56. Taiwan CVD Equipment Market, 2017-2023 24. Patent Filing Trend by Geography, 2008-2018 57. South Korea CVD Equipment Market, 2017-2023 25. Who Supplies Whom 58. RoW CVD Equipment Market (by Country), 2017 26. Value Chain for CVD Equipment 59. Middle East & Africa CVD Equipment Market, 2017-2023 27. Global Memory Market Segmentation 28. Global Memory Market, 2017,2018, and 2023 ($Billion) 60. Latin America CVD Equipment Market, 2017-2023 29. Global DRAM Market ($Billion), 2017-2023 61. Profiles by Ownership Type 30. Global NAND Memory Market ($Billion), 2017-2023 62. Aixtron: Overall Financials, 2015-2017 31. Global Others Memory Market ($Billion), 2017-2023 63. Aixtron: Net Revenue (by Region), 2015-2017 32. Global Foundry Market, by Company Type 64. Aixtron SE: SWOT Analysis 33. Global Foundry Market ($Billion), 2017,2018 and 2023 sales@bisresearch.com | www.bisresearch.com
List of Figures 65. Applied Materials Inc.: Overall Financials, 2015-2017 86. Jusung Engineering Co. Ltd.: SWOT Analysis 66. Applied Materials Inc.: Net Revenue (By Business Segment), 2015-2017 87. Lam Research Corporation: Overall Financials, 2016-2018 67. Applied Materials Inc.: Net Revenue (By Region), 2015-2017 88. Lam Research Corporation: Net Revenue (by Region), 2016-2018 68. Applied Materials Inc.: SWOT Analysis 89. Lam Research Corporation: SWOT Analysis 69. ASM International: Overall Financials, 2015-2017 90. Plasma-Therm: SWOT Analysis 70. ASM International: Net Revenue (by Region), 2015-2017 91. Tokyo Electron Limited: Overall Financials, 2016-2018 92. Tokyo Electron Limited: Net Revenue (By Region), 2016-2018 71. ASM International: SWOT Analysis 72. CVD Equipment Corporation: Overall Financials, 2015-2017 93. Tokyo Electron Limited: Net Revenue (By Business Segment), 2016-2018 73. CVD Equipment Corporation: Net Revenue (by Business Segment), 2015-2017 94. Tokyo Electron Limited: SWOT Analysis 95. ULVAC Inc.: Overall Financials, 2014-2016 74. CVD Equipment Corporation: SWOT Analysis 96. ULVAC Inc.: Net Revenue (by Region), 2014-2016 75. Hitachi Kokusai Electric Inc.: Overall Financials, 2013-2015 97. ULVAC Inc: Net Revenue (by Business Segment), 2014-2016 76. Hitachi Kokusai Electric Inc.: Net Revenue (by Region), 2013-2015 98. ULVAC Inc,: SWOT Analysis 99. Veeco Instruments Inc.: Overall Financials, 2015-2017 77. Hitachi Kokusai Electric Inc.: Net Revenue (by Business Segment), 2013-2015 100. Veeco Instruments Inc: Net Revenue (by Business Segment), 2015-2017 78. Hitachi Kokusai Electric Ltd.: SWOT Analysis 101. Veeco Instruments Inc.: Net Revenue (by Region), 2015-2017 79. IHI Corporation: Overall Financials, 2015-2017 80. IHI Corporation: Net Revenue (by Region), 2015-2017 102. Veeco Instruments Inc.: SWOT Analysis 81. IHI Corporation: Net Revenue (by Business Segment), 2015-2017 103. Scope of the Report 104. Report Design 82. IHI Corporation: SWOT Analysis 105. Secondary Data Sources 83. Jusung Engineering Co. Ltd.: Overall Financials, 2015-2017 106. Top Down and Bottom Up Approach 107. CVD Equipment Market Influencing Factors 84. Jusung Engineering Co. Ltd. Net Revenue (by Business Segment), 2015-2017 108. Assumptions and Limitations 85. Jusung Engineering Co. Ltd.: Net Revenue (by Region), 2015-2017 sales@bisresearch.com | www.bisresearch.com
Research Scope & BIS Methodology 1. Scope of the Report The report constitutes an extensive study of the global CVD equipment market. It includes a thorough analysis of the different semiconductor industry (logic, foundry, memory). The global CVD equipment market has been segmented in terms of geography which helps in understanding the performance of equipment market. It further explains the driving forces, challenges, and growth opportunities of the CVD equipment market. The major players pertaining to the CVD equipment market have been identified based on revenue generation, geographical presence, and market developments. A detailed company profiling has been done to understand the players’ strategic behavior. The geographical analysis has been categorized into four regions, namely: North America, Europe, Asia-Pacific, and Middle-East & Africa and Latin America. Moreover, country analysis has also been done to obtain a clear picture of the global CVD equipment market. Ongoing developments in the regions by the public & private entities are some of the factors based on which different countries’ growth rate has been calculated. 2. Global CVD Equipment Market Research Methodology The research methodology adopted for this specific study includes a mix of data collected from primary and secondary sources. Both primary sources (in-house experts, industry leaders, and market players) and secondary sources (a host of paid and unpaid databases) along with analytical tools were employed to build the forecast and predictive models. Primary Data Sources The primary sources involve the industry experts from the CVD Equipment industry including the suppliers, device manufacturers, and distributors, among others. Resources such as CEOs, vice presidents, marketing directors, and technology & innovation directors, among others, have been interviewed to obtain and verify both the qualitative and quantitative aspects of this research study. The key data points taken from primary sources include: Validation and triangulation of all the numbers and graphs Validation of reports segmentation and key qualitative findings Understanding the competitive landscape Current and proposed production values of a particular product by market players Validation of the number of markets for market type Percentage split of individual markets for geographical analysis sales@bisresearch.com | www.bisresearch.com
Research Scope & BIS Methodology Secondary Data Sources The research study involves the usage of extensive secondary sources such as databases, company websites, and annual reports. Figure 1: Research Methodology Scope Definition Research Design Market Study Qualitative Quantitative Primary Interviews/ Secondary Research Top Down and Bottom Up Primary & Secondary Data Report Writing Data Validation Data Analysis Data Collection sales@bisresearch.com | www.bisresearch.com
Research Scope & BIS Methodology The following figure exhibits the key secondary data sources considered: Figure 2: Data Triangulation BIS Research Internal Repository Key Players Competitive Landscape Opportunities/Challenges Market Size and Market Share (2017) Influencing Factors Market Estimates Geographical Analysis Bis Research Internal Repository DATA TRIANGULATION Primary Sources Secondary Sources Primary Sources Secondary Sources DEMAND SIDE Semiconductor Equipment and Materials International (SEMI) Electronics Industry Association (EIA) Semiconductor Industry Association (SIA) INTERVIEWS WITH: Top management of Logic, Foundry and Memory industry Annual Reports, Presentations, Websites and Press Release of top players, News Articles, Journals, and Paid Databases SUPPLY SIDE INTERVIEWS WITH: Top management of major players in the CVD Equipment market Suppliers REQUEST FOR SAMPLE sales@bisresearch.com | www.bisresearch.com
BIS Research 39111 Paseo Padre PKWY STE 313, Fremont CA 94538-1686, Tel: +1-510-404-8135 Global Delivery Centre Tapasya Corp Heights, Subarea, Sector 126, Noida, NCR-201303 India Tel: +91 120 4261540 / +91 120 4261544 To know more about us, please visit our website: bisresearch.com For other queries contact: sales@bisresearch.com sales@bisresearch.com | www.bisresearch.com sales@bisresearch.com | www.bisresearch.com