Download
1 / 9
90 likes | 106 Vues
The U.S. currently is a home to nearly XX billion networked devices and with growing number of these devices, there will be a surge in the demand for fast processing of data generated from such devices especially the ones which require immediate responses to its user (ex: healthcare, aviation, connected cars etc.). Companies such as Microsoft and Amazon (two leading U.S. based companies in edge space) are investing heavily on Internet of Things. For an Instance, Microsoft announced its intention to invest nearly $XX billion in IoT in the next four years to enabling its customers to transform their businesses with the use of connected devices.

E N D
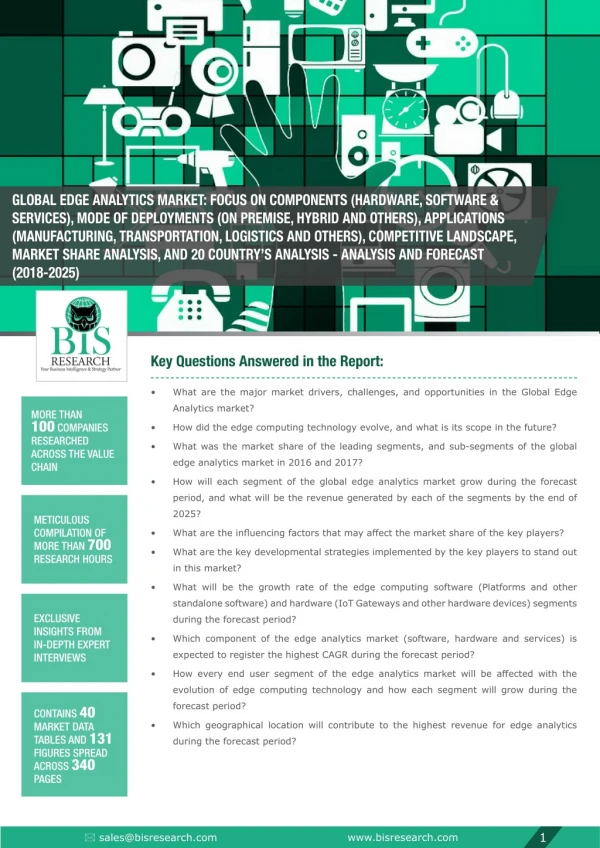
GLOBAL EDGE ANALYTICS MARKET: FOCUS ON COMPONENTS (HARDWARE, SOFTWARE & SERVICES), MODE OF DEPLOYMENTS (ON PREMISE, HYBRID AND OTHERS), APPLICATIONS (MANUFACTURING, TRANSPORTATION, LOGISTICS AND OTHERS), COMPETITIVE LANDSCAPE, MARKET SHARE ANALYSIS, AND 20 COUNTRY’S ANALYSIS - ANALYSIS AND FORECAST (2018-2025) Key Questions Answered in the Report: • What are the major market drivers, challenges, and opportunities in the Global Edge Analytics market? MORE THAN 100 COMPANIES RESEARCHED ACROSS THE VALUE CHAIN • How did the edge computing technology evolve, and what is its scope in the future? • What was the market share of the leading segments, and sub-segments of the global edge analytics market in 2016 and 2017? • How will each segment of the global edge analytics market grow during the forecast period, and what will be the revenue generated by each of the segments by the end of 2025? METICULOUS COMPILATION OF MORE THAN 700 RESEARCH HOURS • Whataretheinfluencingfactorsthatmayaffectthemarketshareofthekeyplayers? • What are the key developmental strategies implemented by the key players to stand out in this market? • What will be the growth rate of the edge computing software (Platforms and other standalone software) and hardware (IoT Gateways and other hardware devices) segments EXCLUSIVE INSIGHTS FROM IN-DEPTH EXPERT INTERVIEWS during the forecast period? • Which component of the edge analytics market (software, hardware and services) is expected to register the highest CAGR during the forecast period? • Howeveryendusersegmentoftheedgeanalyticsmarketwillbeaffectedwiththe evolution of edge computing technology and how each segment will grow during the forecast period? CONTAINS 40 MARKET DATA TABLES AND 131 FIGURES SPREAD ACROSS 340 PAGES • Which geographical location will contribute to the highest revenue for edge analytics during the forecast period? 1 www.bisresearch.com sales@bisresearch.com
TABLE OF CONTENTS • What is an Edge? • Need of Edge Analytics? • Components of Edge Analytics? • Field Protocols • Cloud Protocols • IoT Management Protocols • Security in IoT Protocols • Overview • Impact Analysis • Market Drivers • Market Challenges • Market Opportunities • Key Developments and Strategies • Patent Analysis • Market Share Analysis by Company MARKET OVERVIEW • Overview • On Premise • Hybrid Model MARKET DYNAMICS • Hardware • Software • Services COMPETITIVE LANDSCAPE • Manufacturing and Construction • Transportation and Logistics • Entertainment • Automotive • Healthcare • Retail • Agriculture • Others GLOBAL EDGE ANALYTICS MARKET, BY MODE OF DEPLOYMENT GLOBAL EDGE ANALYTICS MARKET, BY COMPONENTS • North America • Europe •AsiaPacific • Rest of the World (RoW) GLOBAL EDGE ANALYTICS MARKET, BY APPLICATION • AGT International, Inc • Amazon Web Services • Cisco Systems, Inc. • Dell • FogHorn Systems • GE Corporation • Greenwave Systems • HP Inc. • IBM Corporation • Intel Corporation • MachineShop Inc. • Microsoft Corporation • NVIDIA Corporation • Oracle Corporation • PointGrab Ltd. • PTC Inc. SAP SAS Snapshot of Key Players GLOBAL EDGE ANALYTICS MARKET, BY REGION COMPANY PROFILES VIEW COMPLETE TABLE OF CONTENTS 2 www.bisresearch.com sales@bisresearch.com
LIST OF TABLES 19 Overview-FogHorn Systems 1 Country Wise Market Value, 2017 ($Million) 20 Overview-GE Corporation 2 Country Wise Number of Connected Devices, 2017 ($Million) 21 Overview-Greenwave Systems 3 DifferenttypeofSensorsusedinthefieldofIoT 22 Overview-HP Inc. 4 DifferenttypeofSensorsusedinthefieldofIoT 23 Overview-IBM Corporation 5 DifferenttypeofActuatorsusedinthefieldof IoT 24 Overview-Intel Corporation 25 Overview-Machineshop Inc. 6 IoT Transport Layer Standards Comparison 26 Overview-Microsoft Corporation 7 New Security Mechanisms under Development/ Developed to deal with resource constrained IoT devices 27 Overview-NVIDIA Corporation 28 Overview-Oracle Corporation 8 Point of Distinction (Similarities as Well as Differences)BetweenEdgeComputingandData Centre Computing 29 Overview-PointGrab Ltd. 30 Overview-PTC Inc. 31 Overview-SAP 9 Microsoft’s Cloud based Services 32 Overview-SAS 10 Pricing Model for Microsoft’s Azure IoT Platform 33 Overview-ADLINK Technologies Inc. 11 Impact Analysis of Market Navigating Factors 34 Overview-Altizon Systems 12 Commercially available IoT Gateway Hardware 35 Overview-Mimik Technology Inc. 13 Commercially available Edge Computing Software 36 Overview-Open-Silicon, Inc 14 Internet Connectivity in Canada 37 Overview-Zenlayer 15 Overview-AGT International, Inc 38 Overview-Pixeom, Inc. 16 Overview-Amazon Web Services 39 Overview-Qwilt 17 Overview-Cisco Systems, Inc. 40 Overview-Virtuosys 18 Overview-Dell 3 www.bisresearch.com sales@bisresearch.com
LIST OF FIGURES 1 Rising of Connected Devices propelling the Market Growth 2018-2025 ($Million) 27 Other application segment, by Value, 2018-2025 ($Million) 2 A Glimpse of Upcoming Demand for Edge Computing based on IoT Use Cases 28 Global Edge Analytics Solutions Market, by Region 2018-2025 ($Million) 3 Market Drivers and Market Restraints 4 Market Statistics 29 North America Edge Analytics Solutions Market, 2018-2025 ($Million) 5 Figure: Global Edge Analytics Market Share, by Company (2016) 30 North America Edge Analytics Solutions Market, by Country 2018-2025 ($Million) 6 Global Edge Analytics Market (2018-2025) 31 U.S. Edge Analytics Solutions Market, 2018-2025 ($Million) 7 IoTInitiativesindifferentregionsoftheWorld 8 Market Snapshot, Global Edge Analytics Solutions Market, 2018-2025 32 Canada Edge Analytics Solutions Market, 2018- 2025 ($Million) 9 Edge Computing Architecture 33 Europe Edge Analytics Solutions Market, 2018- 2025 ($Million) 10 Components of IoT Gateway within an Edge Computing Environment 34 Europe Edge Analytics Solutions Market, by Country 2018-2025 ($Million) 11 Market Dynamics 12 Share of Key Developments and Strategies 35 Germany Edge Analytics Solutions Market, 2018- 2025 ($Million) 13 Global Edge Analytics Solutions Market Share, by Company (2017) 36 France Edge Analytics Solutions Market, 2018- 2025 ($Million) 14 Cloud Service Models (IaaS, PaaS, and SaaS) 37 Spain Edge Analytics Solutions Market, 2018- 2025 ($Million) 15 Global Edge Analytics Solutions Market, by Components, 2018-2025 ($Million) 38 Italy Edge Analytics Solutions Market, 2018- 2025 ($Million) 16 Global edge computing market by hardware components, 2018-2025 ($Million) 39 U.K. Edge Analytics Solutions Market, 2018-2025 ($Million) 17 Global edge computing market by Software components, 2018-2025 ($Million) 40 Rest of Europe Edge Analytics Solutions Market, 2018-2025 ($Million) 18 Global edge computing market by Services components, 2018-2025 ($Million) 41 AsiaPacificEdgeAnalyticsSolutionsMarket, 2018-2025 ($Million) 19 Spending on Internet of Things by Verticals in 2015 and 2020 (in $billion) 42 AsiaPacificEdgeAnalyticsSolutionsMarket,by Country 2018-2025 ($Million) 20 Global manufacturing and Construction application segment, by Value, 2018-2025 ($Million) 43 India Edge Analytics Solutions Market, 2018- 2025 ($Million) 21 Global Transportation and Logistics application segment, by Value, 2018-2025 ($Million) 44 China Edge Analytics Solutions Market, 2018- 2025 ($Million) 22 Global Entertainment application segment, by Value, 2018-2025 ($Million) 45 Japan Edge Analytics Solutions Market, 2018- 2025 ($Million) 23 Global Automotive application segment, by Value, 2018-2025 ($Million) 46 South Korea Edge Analytics Solutions Market, 2018-2025 ($Million) 24 Global Healthcare application segment, by Value, 2018-2025 ($Million) 47 Australia Edge Analytics Solutions Market, 2018- 2025 ($Million) 25 Global Retail application segment, by Value, 2018-2025 ($Million) 48 RestofAsiaPacificEdgeAnalyticsSolutions Market, 2018-2025 ($Million) 26 Global Agriculture application segment, by Value, 4 www.bisresearch.com sales@bisresearch.com
LIST OF FIGURES 49 Rest of the World (RoW) Edge Analytics Solutions Market, 2018-2025 ($Million) Healthcare Sub Segments : 2016 78 GE Corporation: SWOT Analysis 50 Rest of the World (RoW) Edge Analytics Solutions Market, by Country 2018-2025 ($Million) 79 Greenwave Systems: Product Portfolio 80 Greenwave Systems: SWOT Analysis 51 Mexico Edge Analytics Solutions Market, 2018- 2025 ($Million) 81 HP Inc.: Product Portfolio 82 HP Inc.: Overall Financials (2014-2016) 52 Russia Edge Analytics Solutions Market, 2018- 2025 ($Million) 83 HP Inc.: Net Revenue by Business Segments (2014-2016) 53 Middle East and Africa (MENA) Edge Analytics Solutions Market, 2018-2025 ($Million) 84 HP Inc.: Net Revenue by Personal Systems Segment (2014-2016) 54 Brazil Edge Analytics Solutions Market, 2018- 2025 ($Million) 85 HP Inc.: Net Revenue by Printing Segment (2014-2016) 55 Argentina Edge Analytics Solutions Market, 2018-2025 ($Million) 86 HP Inc.: Net Revenue by Region (2014-2016) 56 Rests of RoW Edge Analytics Solutions Market, 2018-2025 ($Million) 87 HP Inc.: SWOT Analysis 88 IBM Corporation: Product Portfolio 57 AGT International, Inc.: Product Portfolio 89 IBM Corporation: Overall Financials (2015-2017) 58 AGT International, Inc.: SWOT Analysis 90 IBM Corporation: Net Revenue by Business Segment (2015-2017) 59 Amazon Web Services: Product Portfolio 60 Amazon Web Services: SWOT Analysis 91 IBM Corporation: Net Revenue by Region(2015-2017) 61 Cisco Systems, Inc.: Product Portfolio 92 IBM Corporation: SWOT Analysis 62 Cisco Systems, Inc. : Overall Financials (2014- 2016) 93 Intel Corporation: Product Portfolio 63 Cisco Systems, Inc. : Net Revenue by Business Segment (2014-2016) 94 Intel Corporation: Overall Financials (2015- 2017) 64 Cisco Systems, Inc. : Net Revenue by Geography(2014-2016) 95 Intel Corporation: Net Revenue by Business Segment (2015-2017) 65 Cisco Systems, Inc.: SWOT Analysis 96 Intel Corporation: Net Revenue by Geography(2015-2017) 66 Dell: Product Portfolio 97 Intel Corporation: SWOT Analysis 67 Dell: Overall Financials (2014-2016) 98 MachineShop Inc.: Product Portfolio 68 Dell: Net Revenue by Business Segment (2014- 2016) 99 MachineShop Inc.: SWOT Analysis 69 Dell: Net revenue by Region (2014-2016) 100 Microsoft Corporation: Product Portfolio 70 Dell: SWOT Analysis 101 Microsoft Corporation: Overall Financials (2015- 2017) 71 FogHorn Systems: Product Portfolio 102 Microsoft Corporation: Net Revenue by Business Segments (2015-2017) 72 FogHorn Systems: SWOT Analysis 73 GE Corporation: Product Portfolio 103 Microsoft Corporation: Net Revenue by Region (2015-2017) 74 GE Corporation: Overall Financials (2014-2016) 75 GE Corporation: Net Revenue by Business Segments (2014-2016) 104 Microsoft Corporation: SWOT Analysis 105 NVIDIA Corporation: Product Portfolio 76 GE Corporation: Net Revenue by Geography (2014-2016) 106 NVIDIA Corporation: Overall Financials (2015- 2017) 77 GE Corporation: Percentage of Revenues by 5 www.bisresearch.com sales@bisresearch.com
LIST OF FIGURES 107 NVIDIA Corporation : Net Revenue by Business Segments (2015-2017) (2015-2017) 120 PTC Inc. : Net Revenue by Product Segments (2015-2017) 108 NVIDIA Corporation : Net Revenue by Region (2015-2017) 121 PTC Inc. : Net Revenue by Region (2015-2017) 109 NVIDIA Corporation: SWOT Analysis 122 PTC Inc.: SWOT Analysis 110 Oracle Corporation: Product Portfolio 123 SAP: Product Portfolio 111 Oracle Corporation: Overall Financials (2014- 2016) 124 SAP: Overall Financials (2014-2016) 125 SAP: Net Revenue by Business Segment (2014- 2016) 112 Oracle Corporation: Net Revenue by Business Segments (2014-2016) 126 SAP: Revenue by Region (2014-2016) 113 Oracle Corporation: Net Revenue by Geography(2014-2016) 127 SAP: Cloud Subscriptions and Support Revenue by Region (2014-2016) 114 Oracle Corporation: SWOT Analysis 128 SAP: Cloud and Software Revenue by Region (2014-2016) 115 PointGrab Ltd.: Product Portfolio 116 PointGrab Ltd.: SWOT Analysis 129 SAP: SWOT Analysis 117 PTC Inc.: Product Portfolio 130 SAS: Product Portfolio 118 PTC Inc. : Overall Financials (2015-2017) 131 SAS: SWOT Analysis 119 PTC Inc.: Net Revenue by Business Segments 6 www.bisresearch.com sales@bisresearch.com
1 Research Scope & BIS Methodology 1.1 Scope of the Report The report constitutes of an in-depth study of the global edge analytics market, including a thorough analysisofvariousedgesolutionsacrossdifferentregions.Thestudyalsopresentsadetailedanalysis of the market dynamics and the estimation of the market size over the forecast period, 2018 to 2025. The scope of this report is focused on the global edge analytics market, its components, end users, application, and various trends existing in all these segments in conjunction with an in-depth country wise analysis. In the report, 4 categories have been considered. The market value may vary from 5-7%, as the datahavebeencollectedfromdifferentsourcesatregionalandcountrylevel. The market analysis includes an in-depth examination of the key ecosystem players and key strategies & developments taking place in this market. Additionally, it includes market dynamics (market drivers, opportunities and challenges) and industry analysis. The purpose of the study is to gain a holistic view of theedgeanalyticsmarketintermsofvariousfactorsinfluencingit,suchas,recenttrends,technological advancements, and regulatory aspects of the market. The scope of this report is centred upon conducting a detailed study of the solutions allied with the edge analytics market. The market has been segmented into ‘components, ‘application’, ‘mode of deployment’ and ‘geographical regions’. 1.2 BIS Research Market Research Methodology Theresearchmethodologydesignadoptedforthisspecificstudyincludesamixofdatacollectedfrom primary and secondary sources. Both primary sources (in-house experts, industry leaders and market players) and secondary sources (a host of paid and unpaid databases) along with analytical tools have been used exhaustively to build the forecast and predictive models. Figure 1 BIS Research Market Research Methodology RESEARCH APPROACH PRIMARY RESEARCH SECONDARY RESEARCH 1. DATABASE FOR KEY INDUSTRY PARTICIPANTS (DKIP) PREPARATION STUDYING THE MARKET STRUCTURE The primary sources from the supply side include industry experts such as CEOs, vice presidents, marketing directors, technology and innovation directors, and related key executives from various vendors providing technology solutions, associated service providers, and system integrators operatingin the targetedregions. E.g. CIO’s, VP, DirectorNew ProductDevelopment,Director–operations Mainly used to obtain key information about the industry’s value chain, the total pool of key players IDENTIFY MARKET, TECHNOLOGY AND COMPETITOR TRENDS 2. DISCUSSION GUIDE PREPARATION Understand market classification, and segmentation according to industry trends to the bottom-most level, regional markets, and key developments from both market- and technology-oriented perspectives A detailed questionnaire is shared with the primary respondent covering all the aspects related to the report topic 3. SCHEDULING AN APPOINTMENT Appointments are scheduled with CIO’s, VP – healthcare companies, Director with prior appointmentsand the discussionguide is shared with the primary respondentprior to the call INTEGRATE INFORMATION Integrate information within relevant documents to form launch pad for primary research 4. CALL EXECUTION A roundtable discussion is held with the KIP with the aim to gather first hand information about the technology,recent developmentsin the technologyand future outlook/ growthor decline VENDORS CONSULTANT RESELLERS 5. DOCUMENTATION POTENTIAL RESPONDENTS The interview is recorded and the information gathered in put on the drawing board with the informationcollectedthroughsecondary research. END USER MSP’s BIS Research Analysis 10 www.bisresearch.com sales@bisresearch.com
Primary Data Sources The key data points taken from Primary Sources includes: • Validation and Triangulation of all the numbers and graphs • Validationofreportsegmentationandkeyqualitativefindings • Understanding the competitive landscape • Understanding and considering the market dynamics factors for various market segment and sub- segment • Validationofimpactanalysisofmacroandmicrofactorsindifferentcountries • Percentage split of individual markets for geographical analysis Secondary Data Sources The research study involves the usage of extensive secondary sources such as databases, company websites, and annual reports, among others. Thefollowingfigureexhibitskeysecondarydatasourcesconsideredinthisreport: Figure 2 Secondary Data Sources STOCK ANALYST WEBSITES COMPANY SOURCES Seeking Alpha Yahoo Finance Wiki Finance The Wall Street Journal Annual reports Press Releases SEC Filings Investor presentations Financial Disclosures SECONDARY DATA SOURCES GOVERNMENT AND REGULATORY SOURCES PUBLIC AND PRIVATE DATABASES Whitepapers from various companies such as: Cisco Schneider Electric Cognizant and Intel Corporation, among others Edge Computing Consortium OpenFog Consortium Open Edge Computing Automotive Edge Computing Consortium EdgeXFoundry BIS Research Analysis 11 www.bisresearch.com sales@bisresearch.com
The key data points taken from secondary sources include: • Segmentation breakups, split-ups, and percentage shares • Data for market value • Key industry trends of the top players of the market • Qualitative insights into various aspects of the market, key trends, and emerging areas of innovation • Quantitative data for mathematical and statistical calculations Thefollowingfigureexhibitsdatatriangulationconsidered: Figure 3 Data Triangulation PRIMARY SOURCES SECONDARY SOURCES INTERVIEWS WITH: • Whitepapers from companies such as Cisco, Huawei Technologies, Cognizant and schneiderelectric, among others • Top management of leading companies developing edge computing solutions C-level executives of start- up companies innovating in the edge analytics as well as Industrial IoT field Scientists and researchers from renowned universities working in the field of edge computing • National Centerof Biotechnology Information • INFORMATION SOURCED • IEEE journals • Associations such as EdgeXFoundry and Open Edge Computing SUPPLY SIDE • DATA TRIANGULATION PRIMARY SOURCE SECONDARY SOURCE Annual Reports, SEC Filings, Investor Presentations, Websites, and Press Releases of top players, News Articles, Journals, and Paid Databases INFORMATION SOURCED Opportunities/ Challenges Market Size and Market Share Key Players Competitive Landscape Geographical Analysis Influencing Factors Market Estimates Market Trends BIS Research Analysis REQUEST FOR SAMPLE 12 www.bisresearch.com sales@bisresearch.com