Download
1 / 8
90 likes | 125 Vues
Germany leads the Europe waste to energy market in the year 2017 by recording the highest usage of waste for power generation. Increasing economic development in the country leading to generation of increasing volume of waste are the factors supporting the growth of the Germany waste to energy market. The U.K. is expected to be the fastest-growing region from the year 2018 to 2023.

E N D
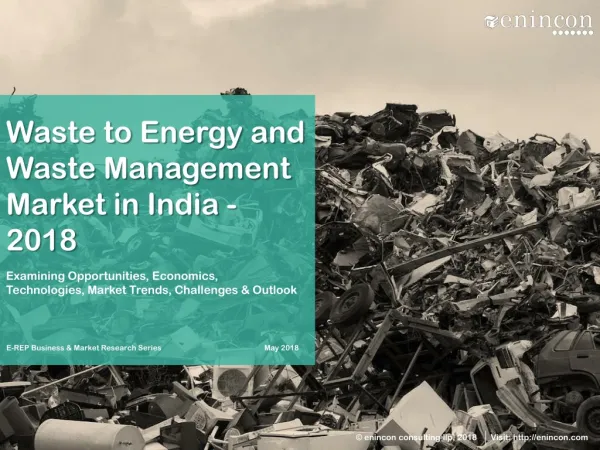
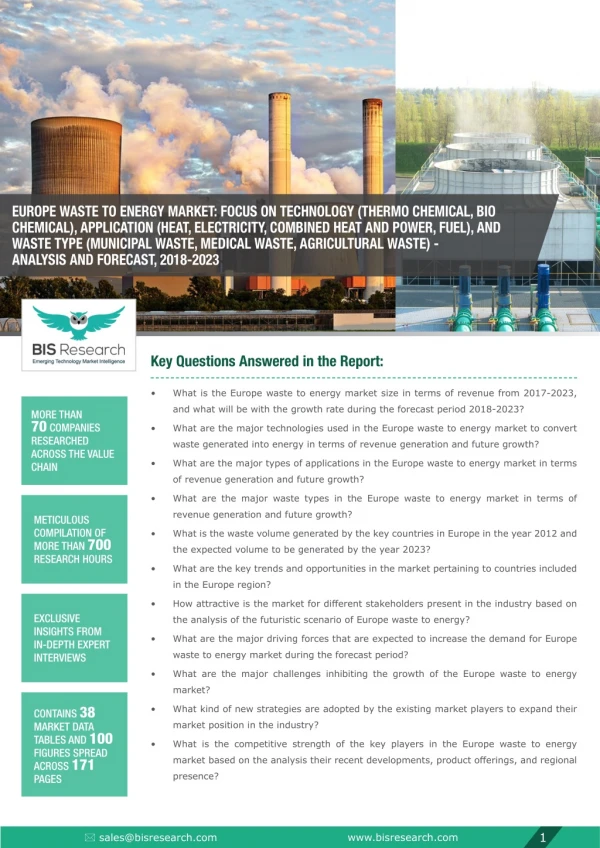
EUROPE WASTE TO ENERGY MARKET: FOCUS ON TECHNOLOGY (THERMO CHEMICAL, BIO CHEMICAL), APPLICATION (HEAT, ELECTRICITY, COMBINED HEAT AND POWER, FUEL), AND WASTE TYPE (MUNICIPAL WASTE, MEDICAL WASTE, AGRICULTURAL WASTE) - ANALYSIS AND FORECAST, 2018-2023 Key Questions Answered in the Report: • What is the Europe waste to energy market size in terms of revenue from 2017-2023, and what will be with the growth rate during the forecast period 2018-2023? MORE THAN 70 COMPANIES RESEARCHED ACROSS THE VALUE CHAIN • What are the major technologies used in the Europe waste to energy market to convert waste generated into energy in terms of revenue generation and future growth? • What are the major types of applications in the Europe waste to energy market in terms of revenue generation and future growth? • What are the major waste types in the Europe waste to energy market in terms of revenue generation and future growth? METICULOUS COMPILATION OF MORE THAN 700 RESEARCH HOURS • What is the waste volume generated by the key countries in Europe in the year 2012 and the expected volume to be generated by the year 2023? • What are the key trends and opportunities in the market pertaining to countries included in the Europe region? • Howattractiveisthemarketfordifferentstakeholderspresentintheindustrybasedon EXCLUSIVE INSIGHTS FROM IN-DEPTH EXPERT INTERVIEWS the analysis of the futuristic scenario of Europe waste to energy? • What are the major driving forces that are expected to increase the demand for Europe waste to energy market during the forecast period? • What are the major challenges inhibiting the growth of the Europe waste to energy market? CONTAINS 38 MARKET DATA TABLES AND 100 FIGURES SPREAD ACROSS 171 PAGES • What kind of new strategies are adopted by the existing market players to expand their market position in the industry? • What is the competitive strength of the key players in the Europe waste to energy marketbasedontheanalysistheirrecentdevelopments,productofferings,andregional presence? 1 www.bisresearch.com sales@bisresearch.com
TABLE OF CONTENTS • Drivers • Restraints • Opportunities RESEARCH SCOPE & METHODOLOGY • Report Scope • Europe Waste to Energy Market Research Methodology • Assumptions • Limitations • Primary Data Sources • Secondary Data Sources • Data Triangulation • Market Estimation and Forecast • Key Market Developments & Strategies • Leading Player Analysis • Industry Attractiveness • Country Share Analysis • Emerging Technologies in the Waste to Energy Process • Municipal Solid Waste Generation in Key Countries of Europe MARKET DYNAMICS • Thermo Chemical Conversion • Bio-Chemical Conversion • Others (Chemical Conversion) COMPETITIVE LANDSCAPE • Municipal Solid Waste (MSW) • Agricultural Waste • Medical Waste • Process Waste • Others INDUSTRY ANALYSIS EUROPE WASTE TO ENERGY MARKET (BY TECHNOLOGY) • Electricity • Heat • Combined Heat and Power (CHP) • Transport Fuels • Others EUROPE WASTE TO ENERGY MARKET (BY WASTE TYPE) EUROPE WASTE TO ENERGY MARKET (BY APPLICATION) • Germany • The U.K. • Poland • France • Norway • The Netherlands • Sweden • Denmark • Austria • Italy • Rest-of-Europe EUROPE WASTE TO ENERGY MARKET (BY COUNTRY) COMPANY PROFILES • BTA International GmbH • Hitachi Zosen Inova AG • Keppel Seghers • MARTIN GmbH • Covanta Energy • Wheelbrator Technologies Inc. • Veolia Group • Waste Management Inc. • Orsted • SAKO BRNO A.S. • Babcock & Wilcox Enterprises Inc. • Austrian Energy & Environment Group VIEW COMPLETE TABLE OF CONTENTS 2 www.bisresearch.com sales@bisresearch.com
LIST OF TABLES 1 Market Snapshot: Europe Waste to Energy Market 21 Europe Waste to Energy Market (by Waste Type), 2017-2023 2 Global Waste to Energy Market( by Technology), $Billion, 2017–2023 22 Recent Developments: Municipal Solid Waste 23 Municipal Waste (by Subtype), 2017-2023 3 Global Waste to Energy Market (by Region), 2017-2023 24 Companies providing Medical Waste Treatment and Disposal Facilities 4 Business Expansion and Contracts by the Leading Companies (2016-2018) 25 Europe Waste to Energy Market (by Application), $Billion ,2017-2023 5 Partnerships and Joint Ventures by the Leading Companies (2016-2018) 26 Recent Developments: Combined Heat and Power 6 Competitive Analysis 27 Upcoming Waste to Energy Plants in Europe by 2030 7 Analyzing the Threat of New Entrants 8 Analyzing the Bargaining Power of Buyers 28 Europe Waste to Energy Market (by Country), 2017–2023 9 Analyzing the Bargaining Power of Suppliers 29 BTA International GmbH: Waste to Energy Technology 10 Analyzing the Threat from Substitutes 11 Analyzing the Intensity of Competitive Rivalry 30 Hitachi Zosen Inova Ag: Energy to Waste Process 12 CarbonEfficiencyComparisonofSeveralBiofuel Production Process 31 Keppel Seghers: Waste to Energy Generation Plants 13 Municipal Solid Waste in Key Countries of Europe 32 MARTIN GmbH: Waste to Energy Facilities 14 Europe Waste to Energy Market (by Technology), 2017-2023 33 Wheelbrator Technologies Inc.: Waste to Energy Facilities 15 Technology Comparison 34 Austrian Energy & Environment Group: Waste to Energy Technologies 16 Recent Developments pertaining to Thermo chemical Technology 35 Babcock & Wilcox Enterprises Inc.: Waste to Energy Technology 17 Anaerobic Digestion: Fuels Required and Output 18 Technology Comparison 36 Orsted: Project Details 19 Recent Developments pertaining to Bio Chemical Technology 37 SAKO BRNO A.S.: Waste to Energy Facility 38 Veolia Environment S.A.: Waste to Energy Generation Solutions 20 Sources of Waste 3 www.bisresearch.com sales@bisresearch.com
LIST OF FIGURES 1 Key Issues in the Waste to Energy Sector in Europe Technology, (2017-2023) 27 Waste to Energy Market Based on Other Technology, (2017-2023) 2 Europe Waste to Energy Market Snapshot 3 Europe Waste to Energy Market (by Technology), Market Share (%) and Market Size 28 Europe Waste to Energy Market, (by Waste Type) 29 Composition of MSW 4 Europe Waste to Energy Market, (by Application) 30 Energy Production from Municipal Solid Waste in Europe, (1995-2015) 5 Europe Waste to Energy Market (by Waste Type) 6 Europe Waste to Energy Market (by Country), 2018 31 Waste to Energy from MSW, (2017-2023) 32 Municipal Waste (by Subtype), 2017 and 2023 7 Global Waste to Energy Market, 2017-2023 33 Waste to Energy from Agricultural Waste, (2017- 2023) 8 Global Waste to Energy Market(by Technology), 2017 and 2023 34 Waste to Energy from Medical Waste, (2017- 2023) 9 Global Waste to Energy Market(by Region), 2017 10 Market Dynamics 35 Waste to Energy from Process Waste, (2017- 2023) 11 Impact Analysis of Drivers 36 Other Type of Waste 12 Global Electricity Generation Mix 37 Waste to Energy from Other Waste, (2017-2023) 13 Impact Analysis of Restraints 38 Europe Waste to Energy Market (by Application), 2017 and 2023 14 Impact Analysis of Opportunities 15 Strategies Adopted by the Key Players 39 Europe Waste to Energy Market (by Application) 16 Share of Key Market Strategies and Developments, June 2016- June 2018 40 Waste to Energy in Electricity, (2017-2023) 41 Waste to Energy in Heat, (2017-2023) 17 Porter’s Five Forces Analysis 42 Waste to Energy in CHP, (2017-2023) 18 Country Share Analysis of Europe Waste to Energy Market, 2017 43 Waste to Energy in Transport Fuels, (2017-2023) 19 Europe Waste to Energy Market(by Technology), 2017 and 2023 44 Other Applications 45 Waste to Energy in Others, (2017-2023) 20 AdvantagesandChallengesofusingGasification Technology 46 Europe Waste to Energy Market (by Country) 47 Europe Waste to Energy Market (by Country), 2017, 2018 and 2023 21 Advantages and Challenges of using Pyrolysis Technology 48 Germany Waste to Energy Market, (2017-2022) 22 Waste to Energy Market Based on Thermo chemical Technology, (2017-2023) 49 The U.K. Number of Waste to Energy Facilities, (2014-2016) 23 Bio chemical Waste to Energy Conversion Process 50 The U.K. Waste to Energy Market, (2017-2023) 51 Poland Waste to Energy Market, (2017-2023) 24 Anaerobic Systems 52 Waste Management Practices in France, 2010 25 Advantages and Challenges of using Fermentation Technology 53 Type of Waste Production in France, 2010 (%) 26 Waste to Energy Market Based on Bio Chemical 54 France Waste to Energy Market, (2017-2023) 4 www.bisresearch.com sales@bisresearch.com
LIST OF FIGURES 55 Norway Waste to Energy Market, (2017-2023) Financials, 2015-2017 56 The Netherlands Waste Generation Data, (1995- 2015) 79 Babcock & Wilcox Enterprises Inc.: Net Revenue by Business Segment, 2015-2017 57 The Netherlands Waste to Energy Market, (2017- 2023) 80 Babcock & Wilcox Enterprises Inc.: Net Revenue by Region Segment, 2015-2017 58 Sweden Waste to Energy Market, (2017-2023) 81 Babcock & Wilcox Enterprises Inc.: SWOT Analysis 59 Denmark Waste to Energy Market, (2017-2023) 82 Orsted: Overall Financials, 2015-2017 60 Austria Waste to Energy Market, (2017-2023) 83 Orsted: Net Revenue by Business Segment, 2017 61 Italy Waste to Energy Market, (2017-2023) 62 Rest of Europe Waste to Energy Market, (2017- 2023) 84 Orsted: Net Revenue by Region Segment, 2015- 2016 63 Share of Key Companies 85 Orsted: SWOT Analysis 64 BTA International GmbH: SWOT Analysis 86 SAKO BRNO A.S.: SWOT Analysis 65 Hitachi Zosen Inova Ag: Overall Financials, 2014-2016 87 Veolia Group: Overall Financials, 2015-2017 88 Veolia Group: Business Segment, 2015-2017 66 Hitachi Zosen Inova Ag: Net Revenue by Business Segment, 2015 89 Veolia Group.: SWOT Analysis 67 Hitachi Zosen Inova Ag: Net Revenue by Business Segment, 2016 90 Waste Management Inc.: Waste to Energy Facilities 68 Hitachi Zosen Inova Ag: Net Revenue by Regional Segment, 2015-2016 91 Waste Management Inc.: Overall Financials, 2015-2017 69 Hitachi Zosen Inova AG: SWOT Analysis 92 Waste Management Inc.: Net Revenue by Business Segment, 2015-2017 70 Keppel Seghers: SWOT Analysis 93 Waste Management Inc.: Net Revenue by Region Segment, 2015-2017 71 MARTIN GmbH: SWOT Analysis 72 Covanta Ltd.: Overall Financials, 2015-2017 94 Waste Management Inc.: SWOT Analysis 73 Covanta Ltd.: Net Revenue by Business Segment, 2015-2017 95 Europe Waste to Energy Market Scope 96 Report Methodology 74 Covanta Ltd.: Net Revenue by Region Segment, 2015-2017 97 Primary Interviews Breakdown, by Player, Designation, and Country 75 Covanta Energy: SWOT Analysis 98 Sources of Secondary Research 76 Wheelbrator Technologies Inc.: SWOT Analysis 99 Data Triangulation 77 Austrian Energy & Environment Group: SWOT Analysis 100 Top Down-Bottom-Up Approach for Market Estimation 78 Babcock & Wilcox Enterprises Inc.: Overall 5 www.bisresearch.com sales@bisresearch.com
1 Research Scope & BIS Methodology 1.1 Scope of the Report The report is a thorough study of the Europe waste to energy market share and market size including the analysis by technology, application, waste type. The Europe waste to energy market by country has also been extensively analyzed in this report including the market trends. Further, the market estimated in differentsectionsofthereportconsidered“2018-2023”astheforecastperiod. Figure 1 Research Scope & Methodology Europe Waste to Energy Market Emerging Waste to Energy Technologies Industry Analysis Market Size Porter’s Five Forces Analysis Key Strategies and Developments Competitive Landscape Influencing Factors Market Drivers Market Restraints Market Opportunities Leading Player Analysis Industry Trends Country-Wise Market (Market Trends and Dynamics) Market Size & Forecast: • By Technology • By Waste Type • By Application • By Country Market Size & Share Analysis Compound Annual Growth Rate (CAGR) High Growth Segments FORECAST Europe Waste to Energy Market Segmentation By Waste Type By Technology By Application By Country By Application • Electricity • Heat • Combined Heat and Power Units • Transport Fuels • Others Germany, U.K.,France, Poland, Norway, The Netherlands, Sweden, Denmark, Austria, Italy and Rest of Europe • Municipal waste • Process waste • Medical waste • Agriculture waste • Others • Thermo Chemical Conversion • Bio Chemical Conversion • Others 6 www.bisresearch.com sales@bisresearch.com
1.2 Europe Waste to Energy Market Research Methodology Theresearchmethodologydesignadoptedforthisspecificstudyincludesamixofdatacollectedfrom primary and secondary sources. The research exhaustively uses both primary sources (in-house experts, industry leaders and market players) and secondary sources (a host of paid and unpaid databases) along with analytical tools to build forecast and predictive models. Primary Data Sources The primary sources involve the industry experts from the Europe waste to energy industry including the experts from waste management industry, and distributors among others. Primary resources such as CEOs, product managers, marketing directors, and technology directors, among others have been interviewed to obtain and verify both qualitative and quantitative aspects of this research study. The research includes interviews with participants throughout the value chain. An extensive questionnaire was shared to get insights from the experts who didn’t participate in discussions. In some cases where information was not available, Delphi method was used to arrive at mutual consent with BIS consultants. The key data points taken from primary sources include: • Validation and triangulation of all the numbers and graphs • Validationofreportsegmentationandkeyqualitativefindings • Understanding the competitive landscape • Validationofthenumberofvariousmarketsfordifferenttypesandapplications • Percentagesplitfordifferentregions Secondary Data Sources This research study involves the usage of extensive secondary sources, directories, company websites, annual reports and investor presentations. It also makes use of databases such as Hoovers, Bloomberg, Business-week, and Factiva to collect the useful information for an extensive, market-oriented, and commercial study of the regional market. Secondary research was done to obtain crucial information about the industry’s value chain, market’s monetary chain, total pool of key players, and the prevalent applications and systems in this sector. The key data points taken from secondary sources include: • Segmentation breakups, split-ups, and percentage shares • Data for market size • Key industry trends of the top players of the market Data Triangulation The process of market engineering involves calculation of the market statistics, market size estimation, market forecast, market crackdown, and data triangulation (the methodology for these quantitative data processes is explained in the further sections). An extensive primary research study was undertaken to gather information, and authenticate the critical numbers arrived through segmentation types, industry trends, and key players of each type of waste to energy technology in the market. 7 www.bisresearch.com sales@bisresearch.com
Figure 1 Data Triangulation PRIMARY SOURCES SECONDARY SOURCES Annual reports of key industrial players SEC Filings 10K reports Investor Presentations Journals Press Releases Paid & Unpaid Databases Waste Management Organization Reports The International Solid Waste Association The European Suppliers of Waste-to-Energy Technology Renewable Energy Association Environmental Services Association • Interviews With: • • • • • • • • Waste to Energy Companies • Energy Equipment Manufacturers INFORMATION SOURCED • Waste Management Companies DATA • • Research Labs TRIANGULATION PRIMARY SOURCE • • State and Regulatory Bodies SECONDARY SOURCE • • INFORMATION SOURCED Market Size and Market Share (2018- 2023) Competitive Landscape Opportunities/ Challenges Key Players Macro-economic Factors Country-Wise Analysis Market Estimates BIS Research Analysis REQUEST FOR SAMPLE 8 www.bisresearch.com sales@bisresearch.com