Download
1 / 10
100 likes | 220 Vues
The growth for this market is driven by factors such as improvement in the food recall process, ease of compliance in global regulation, greater visibility within the inventory system, improved return processes, and rapid shift in consumer preferences.

E N D
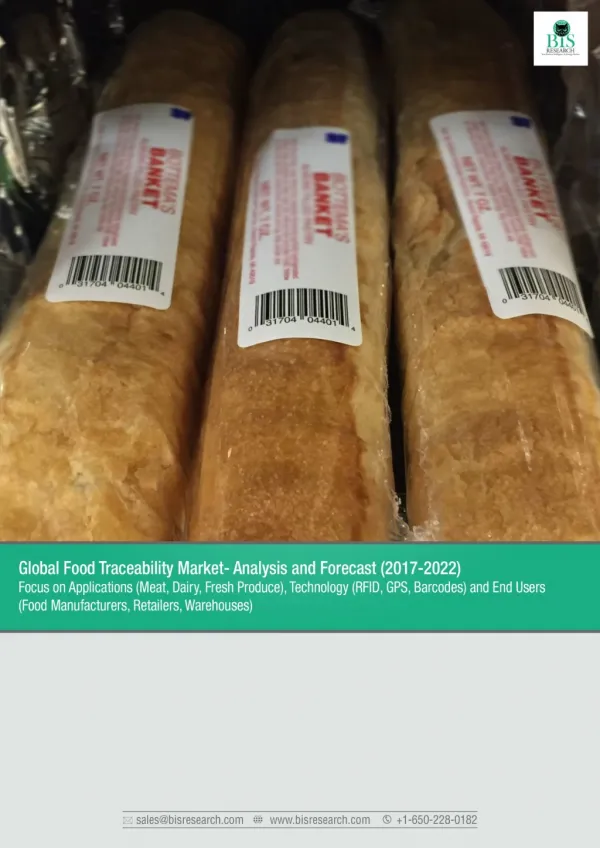
Global Food Traceability Market Analysis and Forecast, 2017-2022 Owing to the to the global increase in the number of food recalls and the rising concerns pertaining to food safety, the food traceability market is expected to grow at a CAGR of 5.56% through 2016 to 2022. The report is a compilation of the different segments of global food traceability market, including market breakdown by the application, technology, end users and geographical areas. Herein the revenue generated from the application type, namely: meat, dairy, fresh produce and others; technology type, namely:RFID, GPS, barcodes and others; end users, namely: Food manufacturers, retailers, warehouses and others; and geography, namely: North America, Europe, APAC and rest of the world is tracked to calculate the overall market size. While highlighting the key driving and restraining forces for this market, the report also provides a detailed summary of the smart food market. It also includes the key participants involved in the industry at the relevant sections. The figure below represents the growth of the food traceability market from 2015 to 2022. Global Food Traceability Market (Y-O-Y), 2014-2022 5.56% 5.79% 5.69% 5.62% 5.50% 5.47% 5.28% 16.09 5.06% 4.43% 11.63 3.21% 2016 2022 2014 2015 2016 2017 2018 2019 2020 2021 2022 Market Size ($Billion) BIS Research Analysis The report puts special emphasis on the market share of the different applications of food traceability technologies, owing to the changing paradigms in the industry. In spite of this, due to the weak technical systems and overlapping and conflicting demands, a majority of potential new entrants resist from adopting food traceability technologies. The reports further includes a thorough analysis of the impact of the five major forces to understand the overall attractiveness of the industry. The report also focuses on the revenue generated by the end users in the food traceability market. The most often used strategy for developing a better hold on to the market has been through mergers & accquisition, followed by business expansion. Moreover, the company profile section highlights significant information about the key companies involved along with their financial www.bisresearch.com
Global Food Traceability Market Analysis and Forecast, 2017-2022 positions, key strategies & developmental activities of recent years. Further, the report includes an exhaustive analysis of the geographical split into North America, Europe, Asia-Pacific (APAC), and Rest of the World (R.o.W.). Each geography details the individual push and pull forces in addition to the key players from that region. The prominent players operating in the global food traceability market are Bio-Rad Laboratories, C.H. Robinson, Cognex Corporation, E.I. DU PONT DE Nemours and Company, Infor, and SGS S.A. COMPETITOR ANALYSIS MARKET SIZE CURRENT MARKET INFORMATION INFLUENCING FACTORS AGREEMENTS, COLLABORATIONS, & PARTNERSHIPS: More than 20 deals in last three years NEW PRODUCT LAUNCHES: More than 40 new product launches in last three years OPPORTUNITY ANALYSIS COMPETITIVE LANDSCAPE REGIONAL ANALYSIS COUNTRY SHARE ANALYSIS MARKET RESTRAINTS MARKET DRIVERS INDUSTRY TRENDS MARKET OPPORTUNITIES PARAMETERS FOR MARKET ESTIMATION By Application By Technology By End User By Region North America (U.S., Canada) Europe ( U.K., France, Germany, Italy, Rest of Europe) Asia-Pacific (China, Japan, India, Australia & Rest of APAC) Rest of the World (Middle East, South Africa & Latin America) Meat Traceability RFID Food Manufacturers Retailers Warehouse/ Pack Farmers Others(Defense and Security Department) Dairy Product Traceability GPS Fresh Produce Traceability Barcodes Others (Seafood Traceability, Others (Near Infrared crop/ grain traceability, Spectroscopy) beverage traceability) The report answers the following questions about the global food traceability market: • What are the different factors driving the market and how will the impact change through the forecast period? • What are the major factors challenging the growth of global food traceability market and how can they be addressed through the forecast period? • How will the market players leverage on key developments such as acquisitions, partnerships, and product launch among others? • Which region will lead the global food traceability market by the end of the forecast period? www.bisresearch.com
Global Food Traceability Market Analysis and Forecast, 2017-2022 • What are the prevalent application type and what is the market size for each of them? • What are the prevalent technology type and what is the market size for each of them? • What are the prevalent end users and what is the market size for each of them? • How will the competitive rivalry evolve through the forecast period? www.bisresearch.com
Global Food Traceability Market Analysis and Forecast, 2017-2022 TABLE OF CONTENTS 5 Food Traceability Market Analysis and Forecast, by Application 5.1 Assumptions & Limitations for Analysis and Forecast of the Global Food Traceability Market 5.2 Market Overview 5.3 Meat Traceability 5.3.1 Meat Traceability Market by Technology 5.3.2 Meat Traceability Market by End Users 5.3.3 Meat Traceability Market by Geography 5.4 Dairy Product Traceability 5.4.1 Dairy Product Traceability Market by Technology 5.4.2 Dairy Product Traceability Market by End Users 5.4.3 Dairy Product Traceability Market by Geography 5.5 Fresh Produce Traceability 5.5.1 Fresh Produce Traceability Market by Technology 5.5.2 Fresh Produce Traceability Market by End Users 5.5.3 Fresh Produce Traceability Market by Geography 5.6 Others 5.6.1 Other Types of Traceability Market by Technology 5.6.2 Other Types of Traceability Market by End Users 5.6.3 Other Types of Traceability Market by Geography 6 Food Traceability Market Analysis and Forecast, by Technology 6.1 Radio Frequency Identification (RFID) 6.2 Global Positioning System (GPS) 6.3 Barcodes 6.4 Others 7 Food Traceability Market, by End-Users 7.1 Food Manufacturers 7.2 Retailers 7.3 Warehouses 7.4 Others 7.4.1 Defence and Security Departments 8 Food Traceability Market, by Geography 8.1 Market Overview Executive Summary 1 Research Scope and Methodology 1.1 Scope of the Study 1.2 Food Traceability Market Research Methodology 1.2.1 Assumptions &Limitations 1.2.2 Primary Data Sources 1.2.3 Secondary Data Sources 2 Industry Analysis 2.1 Opportunity Matrix 2.2 Country Share Analysis 3 Market Dynamics 3.1 Market Drivers 3.1.1 Ease of Compliance in Global Regulations 3.1.2 Greater Inventory Visibility 3.1.3 Improved Food Recall Process 3.1.4 Improved Returns Process 3.1.5 More Timely and Accurate Upstream and Downstream Data 3.1.6 Rapid shift in Consumer Preference 3.2 Market Challenges 3.2.1 Lack of Tracking Records 3.2.2 Overlapping and Conflicting Demands 3.2.3 Weak technical systems 3.3 Market Opportunities 3.3.1 Efficiency in the Supply Chain Operations 3.3.2 Expansion in New Markets 3.3.3 Risk Mitigation Benefits 4 Competitive Insights 4.1 Key Strategies and Developments 4.1.1 Mergers and Acquisitions 4.1.2 Partnership, Agreements, and Collaborations 4.1.3 Product Launch and Development 4.1.4 Business Expansion 4.2 Industry Attractiveness 4.2.1 Threat of New Entrants 4.2.2 Bargaining Power of Buyers 4.2.3 Bargaining Power of Suppliers 4.2.4 Threat from Substitutes 4.2.5 Intensity of Competitive Rivalry www.bisresearch.com
Global Food Traceability Market Analysis and Forecast, 2017-2022 TABLE OF CONTENTS 9.7 Foodlogiq 9.7.1 Overview 9.7.2 SWOT Analysis 9.8 Honeywell International Inc. 9.8.1 Overview 9.8.2 Financials 9.8.2.1 Financial Summary 9.8.3 SWOT Analysis 9.9 INFOR 9.9.1 Overview 9.9.2 SWOT Analysis 9.10 Mar-Kov Computer Systems 9.10.1 Overview 9.10.2 SWOT Analysis 9.11 Mass Group 9.11.1 Overview 9.11.2 SWOT Analysis 9.12 MERIT-TRAX Technologies INC. 9.12.1 Overview 9.12.2 SWOT Analysis 9.13 Picarro Inc. 9.13.1 Overview 9.13.2 SWOT Analysis 9.14 SGS S.A. 9.14.1 Overview 9.14.2 Financials 9.14.2.1 Financial Summary 9.14.3 SWOT Analysis 9.15 Thermo Fisher Scientific 9.15.1 Overview 9.15.2 Financials 9.15.2.1 Financial Summary 9.15.3 SWOT Analysis 9.16 Zebra technologies 9.16.1 Overview 9.16.2 Financials 9.16.2.1 Financial Summary 9.16.3 SWOT Analysis 9.6.2 Financials 9.6.2.1 Financial Summary 9.6.3 SWOT Analysis 8.2 North America 8.2.1 The U.S. 8.2.2 Canada 8.3 Europe 8.3.1 The U.K. 8.3.2 Germany 8.3.3 Italy 8.3.4 France 8.3.5 Rest of Europe 8.4 Asia Pacific 8.4.1 China 8.4.2 India 8.4.3 Japan 8.4.4 Australia 8.4.5 Rest of APAC 8.5 Rest of the World 8.5.1 Middle East 8.5.2 South Africa 8.5.3 Latin America 9 Company Profiles 9.1 Bar Code Integrators Inc. 9.1.1 Overview 9.1.2 SWOT Analysis 9.2 Bio-Rad Laboratories 9.2.1 Overview 9.2.2 Financials 9.2.2.1 Financial Summary 9.2.3 SWOT Analysis 9.3 Carlisle Technology Inc. 9.3.1 Overview 9.3.2 SWOT Analysis 9.4 C.H. Robinson 9.4.1 Overview 9.4.2 Financials 9.4.2.1 Financial Summary 9.4.3 SWOT Analysis 9.5 Cognex Corporation 9.5.1 Overview 9.5.2 Financials 9.5.2.1 Financial Summary 9.5.3 SWOT Analysis 9.6 E. I. DU PONT DE Nemours and Company 9.6.1 Overview www.bisresearch.com
Global Food Traceability Market Analysis and Forecast, 2017-2022 LIST OF TABLE Table 6.1 Global Food Traceability Market – By Technology 2016-2022 Table 7.1 Global Food Traceability Market by End-Users, 2016-2022 Table 8.1 Global Food Traceability Market by Regions, 2016-2022 Table 8.2 North America Food Traceability Market, 2016-2022 Table 8.3 Europe Food Traceability Market, 2016-2022 Table 8.4 Food Traceability Market in APAC by Application Table 8.5 Food Traceability Market in ROW, by Type 2016-2022 Table 4.1 Key Mergers and Acquisitions Table 4.2 Key Partnerships, Agreements, and Collaborations Table 4.3 Key Product Launches and Developments Table 4.4 Key Business Expansion Activities Table 4.5 Analysing the threat of new entrants Table 4.6 Analysing bargaining power of buyers Table 4.7 Analysing the bargaining power of suppliers Table 4.8 Analysing the threat from substitutes Table 4.9 Analysing the intensity of Competitive Rivalry Table 5.1 The Global Food Traceability Market by Applications, 2016-2022 Table 5.2 Meat Traceability companies with the latest technologies Table 5.3 Meat Traceability Market by Technology, 2016-2022 Table 5.4 Meat Traceability Market by End Users, 2016-2022 Table 5.5 Meat Traceability Market by Geography, 2016-2022 Table 5.6 Dairy Product Traceability companies with the latest technologies Table 5.7 Dairy Product Traceability Market by Technology, 2016-2022 Table 5.8 Dairy Product Market by End Users, 2016-2022 Table 5.9 Dairy Product Market by Geography, 2016-2022 Table 5.10 Produce Traceability companies with the latest technologies Table 5.11 Fresh Produce Traceability Market by Technology, 2016-2022 Table 5.12 Fresh Produce Traceability Market by End Users, 2016-2022 Table 5.13 Fresh Produce Traceability Market by Geography, 2016-2022 Table 5.14 Others Traceability Market by Technology, 2016-2022 Table 5.15 Others Traceability Market by End Users, 2016-2022 Table 5.16 Others Traceability Market by Geography, 2016-2022 www.bisresearch.com
Global Food Traceability Market Analysis and Forecast, 2017-2022 LIST OF FIGURES Figure 5.9 Dairy Product Traceability Market by Geography, 2016 & 2022 Figure 5.10 Process of Blockchain technology in Supply chain management Figure 5.11 Fresh Produce Traceability Market by Technology, 2016 & 2022 Figure 5.12 Fresh Produce Traceability Market by End Users, 2016 & 2022 Figure 5.13 Fresh Produce Traceability Market by Geography, 2016 & 2022 Figure 5.14 Others Traceability Market by Technology, 2016 & 2022 Figure 5.15 Others Traceability Market by End Users, 2016 & 2022 Figure 5.16 Others Traceability Market by Geography, 2016 & 2022 Figure 6.1 Technologies used in Food Traceability Figure 6.2 Global Food Traceability Market – By Technology Figure 6.3 Drawbacks of using RFID system on cattle Figure 6.4 Use of RFID among the traceability applications Figure 7.1 End Users of the Food Traceability Market Figure 7.2 Global Food Traceability Market, By End-Users (2016-2022) Figure 7.3 Key focusing points for the retailers Figure 8.1 Geography Segmentation of the Food Traceability Figure 8.2 Global Food Traceability Market by Key Countries Figure 8.3 Food Traceability Market in North America Figure 8.4 Food Traceability Market in North America – By Application Figure 8.5 Consumer preferences on traceability Figure 8.6 Food Traceability Market in Europe, 2016 to 2022 Figure 8.7 Food Traceability Market in Europe- By Application Figure 8.8 Reason for product recalls in Germany, 2012 Figure 8.9 Food Traceability Market in APAC – By Region Figure 1 Global Food Traceability Market Snapshot Figure 2 Global Food Traceability Market Share by Application, 2016 and 2022 Figure 3 Global Food Traceability Market Share by Technology, 2016 and 2022 Figure 4 Global Food Traceability Market Share by End-Users, 2016 and 2022 Figure 5 Global Food Traceability Market Share by Geography, 2016 and 2022 Figure 1.1 The Global Food Traceability Market Scope Figure 1.2 Top Down and Bottom Up Approach Figure 2.1 Global Food Traceability Market Opportunity Matrix, by Region, 2016 Figure 2.2 Global Food Traceability Market Opportunity Matrix, by Country, 2016 Figure 2.3 Global Food Traceability Market Opportunity Matrix, by Country, 2022 Figure 2.4 Country Share Analysis of Global Food Traceability Market, 2016 Figure 3.1 Market Dynamics Figure 3.2 Impact Analysis of Market Drivers Figure 3.3 Impact Analysis of Market Challenges Figure 4.1 Key Strategies & Developments adopted by Market Players Figure 4.2 Share of Key Strategies and Developments Figure 4.3 Porter’s Five Forces Analysis for the Food Traceability Market Figure 5.1 Global Food Traceability Market by Applications Figure 5.2 Global Food Traceability Market by Applications, 2016 & 2022 Figure 5.3 Consumer Awareness Survey – Food Production (2012) Figure 5.4 Meat Traceability Market by Technology, 2016 & 2022 Figure 5.5 Meat Traceability Market by End Users, 2016 & 2022 Figure 5.6 Meat Traceability Market by Geography, 2016 & 2022 Figure 5.7 Dairy Product Traceability Market by Technology, 2016 & 2022 Figure 5.8 Dairy Product Traceability Market by End Users, 2016 & 2022 www.bisresearch.com
Global Food Traceability Market Analysis and Forecast, 2017-2022 LIST OF FIGURES Figure 9.17 SGS S.A.: Net Revenue by Geography 2014-2016 ($Billion) Figure 9.18 Thermo Fisher Scientific: Overall Financials 2014-2016 ($Billion) Figure 9.19 Thermo Fisher Scientific: Net Revenue by Business Segments 2014-2016 ($Billion) Figure 9.20 Thermo Fisher Scientific: Net Revenue by Geography 2013-2015 ($Billion) Figure 9.21 Zebra Technologies.: Overall Financials 2013-2015 ($Billion) Figure 9.22 Zebra Technologies: Net Revenue by Business Segments 2013-2015 ($Billion) Figure 9.23 Zebra Technologies: Net Revenue by Geography 2013-2015 ($Billion) Figure 8.10 Food Traceability Market in APAC by Application Figure 8.11 Roles of Food Traceability Systems Figure 8.12 Australian Traceability Programs and Association Figure 8.13 Geographical Regions in Rest of the World (ROW) Figure 8.14 Food Traceability Market in ROW – By Application Figure 8.15 Food Traceability in RoW by Application Figure 9.1 Bio-Rad Laboratories: Overall Financials, 2014-2016 Figure 9.2 Bio-Rad Laboratories: Geographic Revenue Mix, 2014-2016 Figure 9.3 Bio-Rad Laboratories: Business Revenue Mix, 2014-2016 Figure 9.4 C.H. Robinson: Overall Financials, 2014-2016 Figure 9.5 C.H. ROBINSON: Net Revenue by Business Segments, 2014-2016 Figure 9.6 C.H. ROBINSON: Net Revenue by Transportation Segment 2014-2016($Billion) Figure 9.7 Cognex Corporation: Overall Financials 2014-2016 ($Billion) Figure 9.8 Cognex: Net Revenue by Geography 2014-2016 ($Billion) Figure 9.9 DuPont Nutrition & Health Corporation: Overall Financials 2014- 2016 Figure 9.10 DuPont Nutrition & Health: Business Revenue Mix, 2014-2016 Figure 9.11 DuPont Nutrition & Health: Net Revenue by Geography 2014-2016 ($Billion) Figure 9.12 Honeywell: Overall Financials 2014- 2016 ($Billion) Figure 9.13 Honeywell: Net Revenue by Business Segments 2014-2016 Figure 9.14 Honeywell: Net Revenue by Geography 2014-2016 ($Billion) Figure 9.15 SGS S.A.: Overall Financials 2014- 2016 ($Billion) Figure 9.16 SGS S.A.: Net Revenue by Business Segments 2014-2016 ($Billion) www.bisresearch.com
Global Food Traceability Market Analysis and Forecast, 2017-2022 DISCLAIMER BIS Research provides valuable market intelligence to an exclusive group of customers in response to orders. The report is licensed for the customer’s internal use only and is subject to restrictions set henceforth. This document and its contents are confidential and may not be further distributed, published or reproduced, in whole or in part, by any medium or in any form for any purpose, without the express written consent of BIS Research. Customer will not disclose the contents of the report, whether directly in any media or indirectly through incorporation in a database, marketing list, report or otherwise, or use or permit the use of Information to generate any statistical or other information that is or will be provided to third parties; or voluntarily produce Information in legal proceedings. Market reports are based on expectations, estimates and projections as of the date such information is available. Any recommendation contained in this report may not be suitable for all investors or businesses. The market conclusions drawn are necessarily based upon a number of estimates and assumptions that, while considered reasonable by BIS Research as of the date of such statements, are inherently subject to market fluctuations and business, economic and competitive uncertainties and contingencies. For more details regarding permission, please contact us: Email: sales@bisresearch.com Tel: +1 650 228 0182 www.bisresearch.com