Download
1 / 12
120 likes | 201 Vues
The growing demand of unmanned underwater vehicles for naval applications, increase in offshore oil and gas activities and growing need for oceanography are the major factors driving the unmanned underwater vehicle market. The different types of unmanned underwater vehicles include: remotely operated vehicles, autonomous underwater vehicles and hybrid vehicles. By analysis, unmanned underwater vehicle market generated $2,652.62 million in 2016, in terms of revenue.

E N D
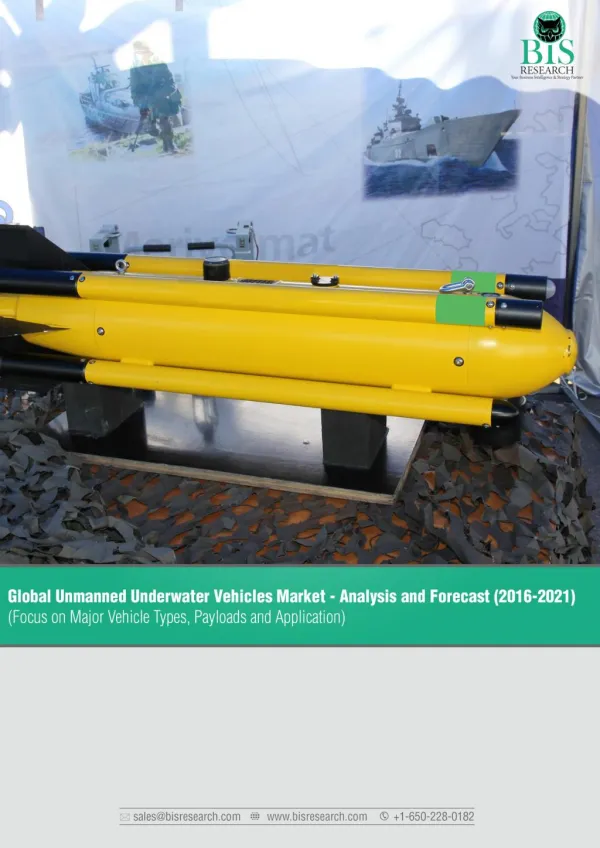
Global Unmanned Underwater Vehicles Market - Analysis and Forecast (2016-2021) (Focus on Major Vehicle Types, Payloads and Application) Maritime systems have emerged to be a powerful tool for commercial, defense and scientific research applications. The system has been constantly evolving at a rapid pace, with an impending need for updations in maritime technology. Unmanned Underwater Vehicles (UUVs) are defined as the systems that are able to operate under sea without the human operator inside. With various innovations in the field of undersea technology, new forms of systems are being developed that are highly autonomous, light weight and are easy to operate. The unmanned underwater vehicle market is experiencing an advanced rate of growth over the past years due to the increasing demand in commercial, defense and military and scientific research applications. This high scale of growth of the unmanned underwater vehicle industry is subsequently influencing the market, wherein new range of programs are being carried out to develop latest unmanned underwater technologies. The growing demand of unmanned underwater vehicles for naval applications, increase in offshore oil and gas activities and growing need for oceanography are the major factors driving the unmanned underwater vehicle market. Global Unmanned Underwater Vehicles Market, 2015-2021 ($ Million) Annual reports, SEC Filings, and Press Releases of Key Players in the Market; Journals; White Papers; Paid Databases; Primary Interviews; and BIS Research Analysis www.bisresearch.com
Global Unmanned Underwater Vehicles Market - Analysis and Forecast (2016-2021) (Focus on Major Vehicle Types, Payloads and Application) The UUV market reported a revenue of $2,652.62 million in 2016 with the remotely operated vehicles segment accommodating for the highest revenue by 2021. Following points provide a concrete description of the report content and the topics covered in the report: • This report identifies the global unmanned underwater vehicles market under different segments such as UUV type, payload, application and geography • The report also highlights the value chain of the industry with a major focus on technology roadmap • What are the different factors driving the market towards growth in the forecast period? • What are the major factors challenging the growth of unmanned underwater vehicles market? • What kind of new strategies are being adopted by existing market players to make a mark in the industry? • Several ongoing programs for advancement of unmanned underwater vehicles are included in this report • The key market players are analyzed and profiled in detail in the report. This section covers the business financials, company snapshots, key products & services, major developments, future programs (if any), and finally, the individual SWOT analysis. www.bisresearch.com
Global Unmanned Underwater Vehicles Market - Analysis and Forecast (2016-2021) (Focus on Major Vehicle Types, Payloads and Application) Analysis & Forecast: Base Year: 2015 Estimated Year: 2016 5 Year Annual Estimated Forecast (2016-2021) Market by UUV Type: Remotely Operated Vehicles (ROVs), Autonomous Underwater Vehicles (AUVs), and Hybrid Underwater Vehicles Market by Payload: Camera, Sonar, Sensors, Inertial Navigation System and Others Market by Application: Commercial, Defense and Security, and Scientific Research Market by Geography: North America (U.S., Canada and Others), Europe (U.K., Germany, Russia, Norway, France and Others), Asia-Pacific (China, Japan, India, South Korea and Others), and Rest of the World (Latin America, Middle East and Africa) www.bisresearch.com
Global Unmanned Underwater Vehicles Market - Analysis and Forecast (2016-2021) (Focus on Major Vehicle Types, Payloads and Application) TABLE OF CONTENTS Executive Summary 1 Research Scope & BIS Methodology 1.1 Scope of the Report 1.2 Unmanned Underwater Vehicles Market Research Methodology 2 Market Dynamics 2.1 Market Drivers 2.1.1 Growing Demand of UUVs for Naval Applications 2.1.2 Increase in Offshore Oil & Gas Activities 2.1.3 Growing Need for UUVs in Oceanography 2.2 Market Challenges 2.2.1 Navigational Issues with UUVs 2.2.2 Operational Complexities with UUVs 2.3 Market Opportunities 2.3.1 Emergence of Hybrid UUVs 2.3.2 Technological Advancements in UUVs 3 Competitive Insights 3.1 Competitive Landscape 3.2 Key Strategies and Developments 3.2.1 Partnerships, Agreements and Contracts 3.2.2 Product Launches 3.2.3 Mergers and Acquisitions 3.2.4 Other Developments 4 Industry Analysis 4.1 Evolution of Unmanned Underwater Vehicles 4.2 Classification of Unmanned Underwater Vehicles 4.3 Technology Roadmap for Unmanned Underwater Vehicles 4.4 Major Expenditure (R&D, Proc. and O&M) on Unmanned Systems, 2014-2018 4.5 UUV Product Mapping with Key Manufacturers 4.5.1 An Overview on Unmanned Underwater Vehicles Products 4.6 Pricing of Autonomous Underwater Vehicles 4.7 Value Chain Analysis 5 Global Unmanned Underwater Vehicles Market, 2015-2021 5.1 Assumptions and Limitations 5.2 Market Overview 6 Unmanned Underwater Vehicles Market by UUV Type 6.1 Market Overview 6.2 UUV Types Market by Application, 2015-2021 6.3 Remotely Operated Vehicles (ROVs) Market Size, 2015-2021 6.3.1 Remotely Operated Vehicles Market Size by Product Type, 2015 – 2021 6.4 Autonomous Underwater Vehicles (AUVs) Market Size, 2015-2021 6.4.1 Autonomous Underwater Vehicles Market Size by Product Type, 2015 – 2021 6.5 Hybrid Underwater Vehicles Market Size, 2015-2021 7 Unmanned Underwater Vehicles Market by Payload 7.1 Market Overview 7.2 Camera 7.3 Sonar 7.4 Sensors 7.5 Inertial Navigation System 7.6 Others 8 Unmanned Underwater Vehicles Market by Application 8.1 Market Overview 8.2 Unmanned Underwater Vehicles Market for Commercial Application, 2015-2021 8.3 Unmanned Underwater Vehicles Market for Defense and Security Application, 2015-2021 8.4 Unmanned Underwater Vehicles Market for Scientific Research Application, 2015-2021 9 Unmanned Underwater Vehicles Market by Geography www.bisresearch.com
Global Unmanned Underwater Vehicles Market - Analysis and Forecast (2016-2021) (Focus on Major Vehicle Types, Payloads and Application) TABLE OF CONTENTS 9.1 Market Overview 9.2 The North American UUVs Market, 2015-2021 9.2.1 UUVs Market Size in the U.S., 2015-2021 9.2.2 UUVs Market Size in Canada, 2015-2021 9.3 European UUVs Market Size, 2015-2021 9.3.1 UUVs Market Size in the U.K., 2015-2021 9.3.2 UUVs Market Size in Germany,2015-2021 9.3.3 UUVs Market Size in Russia,2015-2021 9.3.4 UUVs Market Size in Norway, 2015-2021 9.3.5 UUVs Market Size in France, 2015-2021 9.4 Asia Pacific UUVs Market Size, 2015-2021 9.4.1 UUVs Market Size in China, 2015-2021 9.4.2 UUVs Market Size in Japan, 2015-2021 9.4.3 UUVs Market Size in India, 2015-2021 9.4.4 UUVs Market Size in South Korea, 2015- 2021 9.5 Rest of the World UUVs Market Size, 2015- 2021 10 Company Profile 10.1 BAE Systems 10.1.1 Company Overview 10.1.2 Financials 10.1.2.1 Overall Financials 10.1.2.2 Segment Revenue Mix 10.1.2.3 Geographic Revenue Mix 10.1.3 SWOT Analysis 10.2 FMC Technologies 10.2.1 Company Overview 10.2.2 Financials 10.2.2.1 Overall Financials 10.2.2.2 Segment Revenue Mix 10.2.2.3 Geographic Revenue Mix 10.2.3 SWOT Analysis 10.3 Fugro 10.3.1 Company Overview 10.3.2 Financials 10.3.2.1 Overall Financials 10.4 General Dynamics 10.4.1 Company Overview 10.4.2 Financials 10.4.2.1 Overall Financials 10.4.2.2 Revenue Mix 10.4.2.3 Geographic Revenue Mix 10.4.3 SWOT Analysis 10.5 Kongsberg Gruppen 10.5.1 Company Overview 10.5.2 Financials 10.5.2.1 Overall Financials 10.5.2.2 Segment Revenue Mix 10.5.2.3 Geographic Revenue Mix 10.5.3 SWOT Analysis 10.6 Lockheed Martin 10.6.1 Company Overview 10.6.2 Financials 10.6.2.1 Overall Financials 10.6.2.2 Segment Revenue Mix 10.6.2.3 Geographic Revenue Mix 10.6.3 SWOT Analysis 10.7 Oceaneering International 10.7.1 Company Overview 10.7.2 Financials 10.7.2.1 Overall Financials 10.7.2.2 Segment Revenue Mix 10.7.2.3 Geographic Revenue Mix 10.7.3 SWOT Analysis 10.8 SAAB 10.8.1 Company Overview 10.8.2 Financials 10.8.2.1 Overall Financials 10.8.2.2 Segment Revenue Mix 10.8.2.3 Geographic Revenue Mix 10.3.3 SWOT Analysis 10.3.2.2 Segment Revenue Mix 10.3.2.3 Geographic Revenue Mix www.bisresearch.com
Global Unmanned Underwater Vehicles Market - Analysis and Forecast (2016-2021) (Focus on Major Vehicle Types, Payloads and Application) TABLE OF CONTENTS 10.9 Subsea 7 10.9.1 Company Overview 177 10.9.2 Financials 178 10.9.2.1 Overall Financials 178 10.9.2.2 Segment Revenue Mix 179 10.9.2.3 Geographic Revenue Mix 180 10.9.3 SWOT Analysis 181 10.10 Teledyne Technologies 182 10.10.1 Company Overview 182 10.10.2 Financials 183 10.10.2.1 Overall Financials 183 10.10.2.2 Segment Revenue Mix 184 10.10.2.3 Geographic Revenue Mix 185 10.10.3 SWOT Analysis 186 11 Appendix 187 11.1 Quotes by Leading Players 187 11.2 Related Reports 190 10.8.3 SWOT Analysis www.bisresearch.com
Global Unmanned Underwater Vehicles Market - Analysis and Forecast (2016-2021) (Focus on Major Vehicle Types, Payloads and Application) LIST OF TABLE Table 1 Classification of UUVs Table 2 Global UUV Market Overview Table 3.1 Key Contracts, Agreements and Partnerships Table 3.2 Key Product Launches Table 3.3 Mergers, Acquisitions, and Joint Ventures Table 3.4 Other Developments Table 4.1 Typical AUVs Data Table 4.2 The U.S. Department of Defense (DoD) Funding on Unmanned Systems ($ Million) Table 4.3 UUV Product Mapping with Key Manufacturers Table 4.4 Pricing of AUVs, 2016 Table 5.1 Global Unmanned Underwater Vehicles Market 2015-2021 ($ Million) Table 6.1 Unmanned Underwater Vehicles Market Size by UUV Type, 2015-2021 ($ Million) Table 6.2 UUV Type Market with respect to Application, 2015-2021 ($ Million) Table 6.3 Remotely Operated Vehicles Market Size by Product Type, 2015 – 2021 Table 6.4 Autonomous Underwater Vehicles Market Size by Product Type, 2015 – 2021 Table 6.5 Autonomous Underwater Vehicles Product Mapping with AUV Type Table 7.1 Unmanned Underwater Vehicles Market by Payload, 2015 -2021 ($ Million) Table 8.1 UUV Users in the U.S. for Commercial Application Table 8.2 Suitability Analysis of UUVs for Naval Missions Table 8.3 UUV Users in the U.S. for Scientific and Academic Application Table 8.4 Other Government Users of UUV in the U.S. Table 9.1 Unmanned Underwater Vehicles Market Size by Geography, 2015-2021 ($ Million) Table 9.2 The U.S. DoD Funding on Maritime Systems, 2014-2018 ($ Million) Table 9.3 The U.S. Navy Proposed Procurement Budget FY17 Table 9.4 Major UUV Manufacturers in the U.S. Table 9.5 UUVs Market Size in Rest of the World, 2015-2021 ($ Million) Table 10.1 SAAB Business Segments Table 10.2 SAAB Underwater Systems www.bisresearch.com
Global Unmanned Underwater Vehicles Market - Analysis and Forecast (2016-2021) (Focus on Major Vehicle Types, Payloads and Application) LIST OF FIGURES Figure 1 Piracy in Southeast Asia, 1995-2014 Figure 2 Applications of Unmanned Underwater Vehicles Figure 3 Unmanned Underwater Vehicles Market Size, 2016-2022 Figure 4 Unmanned Underwater Vehicle Market by UUV Type, 2015 and 2021 Figure 5 UUV Type Market by Application, 2015 Figure 6 Unmanned Underwater Vehicles Market by Application, 2015–2021 ($ Million) Figure 7 Ranking of UUV Market by Application, 2015 and 2021 Figure 8 Unmanned Underwater Vehicles Market by Geography, 2015-2021 ($ Million) Figure 9 Unmanned Underwater Vehicle Market by Geography, CAGR% (2015-2021) Figure 1.1 Unmanned Underwater Vehicles Market Scope Figure 1.2 Secondary Data Sources Figure 1.3 Top Down and Bottom up Approach Figure 1.4 Unmanned Underwater Vehicles Market Influencing Factors Figure 1.5 Assumptions and Limitations Figure 2.1 Market Dynamics Snapshot Figure 2.2 Market Drivers–Impact Analysis, 2015- 2021 Figure 2.3 Market Challenges–Impact Analysis, 2015-2021 Figure 2.4 Global Oil Demand and Supply, 2008- 2015 Figure 2.5 Major Challenges of Underwater Acoustic Network Figure 3.1 Some of the Organic and Inorganic Growth Strategies Adopted by the Key Players Figure 3.2 Percentage Share of Strategies Adopted by the Market Players, 2014-2016 Figure 4.1 Evolution of Autonomous Underwater Vehicles (AUVs) Figure 4.2 Brief Classification of UUVs Figure 4.3 Functional Analysis of Naval UUVs Figure 4.4 UUV Energy Options vs. Vehicle Size Figure 4.5 Technology Roadmap for UUVs Figure 4.6 Detailed Overview on UUVs Figure 4.7 Value Chain Analysis Figure 6.1 Classification of Unmanned Underwater Vehicles Market by UUV Type Figure 6.2 Unmanned Underwater Vehicles Market Share by UUV Type, 2015 and 2021 Figure 6.3 UUV Type Market Share With Respect to Application, 2015 and 2021 Figure 6.4 Remotely Operated Vehicles Market Size, 2015 and 2021 Figure 6.5 Autonomous Underwater Vehicles Market Size, 2015 and 2021 Figure 6.6 Hybrid Underwater Vehicles Market Size, 2015 and 2021 Figure 7.1 Classification of Unmanned Underwater Vehicles by Payload Figure 7.2 Unmanned Underwater Vehicles Market by Camera, 2015 -2021 ($ Million) Figure 7.3 Unmanned Underwater Vehicles Market for Sonar, 2015 -2021 ($ Million) Figure 7.4 Unmanned Underwater Vehicles Market for Sensors, 2015 -2021 ($ Million) Figure 7.5 Unmanned Underwater Vehicles Market for INS, 2015 -2021 ($ Million) Figure 7.6 Unmanned Underwater Vehicles Market for Others, 2015 -2021 ($ Million) Figure 8.1 Classification of Unmanned Underwater Vehicles by Application Figure 8.2 Unmanned Underwater Vehicles Market Share by Application, 2015-2021 Figure 8.3 UUV Market Size for Commercial Application, 2015 and 2021 Figure 8.4 UUVs Demand in Commercial Application Figure 8.5 UUV Market Size for Defense and Security Application, 2015 and 2021 www.bisresearch.com
Global Unmanned Underwater Vehicles Market - Analysis and Forecast (2016-2021) (Focus on Major Vehicle Types, Payloads and Application) LIST OF FIGURES Figure 8.6 UUVs in accordance with the Naval Missions Figure 8.7 UUV Market Size for Scientific Research Application, 2015 and 2021 Figure 9.1 Classification of Unmanned Underwater Vehicle Market by Geography Figure 9.2 Geographic Distribution of Unmanned Underwater Vehicles Market, 2015 and 2021 Figure 9.3 North American UUVs Market Size, 2015- 2021 Figure 9.4 UUVs Market Size in the U.S., 2015-2021 Figure 9.5 Canadian UUV Market Size, 2015-2021 Figure 9.6 European UUVs Market Size, 2015-2021 Figure 9.7 European UUV Market Size by Country, 2015-2021 Figure 9.8 European UUV Market Size, by Country 2015 Figure 9.9 UUVs Market Size in the U.K., 2015-2021 Figure 9.10 UUVs Market Size in Germany, 2015- 2021 Figure 9.11 UUVs Market Size in Russia, 2015-2021 Figure 9.12 UUVs Market Size in Norway, 2015-2021 Figure 9.13 UUVs Market Size in France, 2015-2021 Figure 9.14 APAC UUVs Market Size, 2015-2021 Figure 9.15 UUVs Market Size in China, 2015-2021 Figure 9.16 UUVs Market Size in Japan, 2015-2021 Figure 9.17 UUVs Market Size in India, 2015-2021 Figure 9.18 UUVs Market Size in South Korea, 2015- 2021 Figure 9.19 Rest of the World UUVs Market Size, 2015-2021 Figure 9.20 UUVs Market Size in Rest of the World, 2015 & 2021 ($ Million) Figure 10.1 BAE Systems–Overall Financials, 2013- 2015 Figure 10.2 BAE Systems–Business Segment Revenue Mix, 2013-2015 Figure 10.3 BAE Systems–Geographic Revenue Mix, 2013-2015 Figure 10.4 FMC Technologies–Overall Financials, 2013-2015 Figure 10.5 FMC Technologies–Business Segment Revenue Mix, 2013-2015 Figure 10.6 FMC Technologies–Geographic Revenue Mix, 2013-2015 Figure 10.7 Fugro–Overall Financials, 2013-2015 Figure 10.8 Fugro– Business Segment Revenue Mix, 2013-2015 Figure 10.9 Fugro– Geographic Revenue Mix, 2013- 2015 Figure 10.10 General Dynamics–Overall Financials, 2013-2015 Figure 10.11 General Dynamics–Business Segment Revenue Mix, 2013-2015 ($Million) Figure 10.12 General Dynamics–Geographic Revenue Mix, 2013-2015 ($ Million) Figure 10.13 Kongsberg Gruppen–Overall Financials, 2013-2015 Figure 10.14 Kongsberg Gruppen–Business Segment Revenue Mix, 2013-2015 Figure 10.15 Kongsberg Gruppen–Geographic Revenue Mix, 2013-2015 Figure 10.16 Lockheed Martin–Overall Financials, 2013-2015 Figure 10.17 Lockheed Martin–Business Segment Revenue Mix, 2013-2015 ($ Million) Figure 10.18 Lockheed Martin–Geographic Revenue Mix, 2013-2015 ($ Million) Figure 10.19 Oceaneering International–Overall Financials, 2013-2015 Figure 10.20 Oceaneering International–Business Segment Revenue Mix, 2013-2015 Figure 10.21 Oceaneering International–Geographic Revenue Mix, 2013-2015 Figure 10.22 SAAB – Overall Financials, 2013-2015 Figure 10.23 SAAB– Business Segment Revenue Mix, 2013-2015 Figure 10.24 SAAB– Geographic Revenue Mix, 2013- www.bisresearch.com
Global Unmanned Underwater Vehicles Market - Analysis and Forecast (2016-2021) (Focus on Major Vehicle Types, Payloads and Application) LIST OF FIGURES 2015 Figure 10.25 Subsea 7– Overall Financials, 2013- 2015 Figure 10.26 Subsea 7– Business Segment Revenue Mix, 2013-2015 Figure 10.27 Subsea 7– Geographic Revenue Mix, 2013-2015 Figure 10.28 Teledyne Technologies–Overall Financials, 2013-2015 Figure 10.29 Teledyne Technologies–Business Segment Revenue Mix, 2013-2015 Figure 10.30 Teledyne Technologies–Geographic Revenue Mix, 2013-2015 www.bisresearch.com
Global Unmanned Underwater Vehicles Market - Analysis and Forecast (2016-2021) (Focus on Major Vehicle Types, Payloads and Application) DISCLAIMER BIS Research provides valuable market intelligence to an exclusive group of customers in response to orders. The report is licensed for the customer’s internal use only and is subject to restrictions set henceforth. This document and its contents are confidential and may not be further distributed, published or reproduced, in whole or in part, by any medium or in any form for any purpose, without the express written consent of BIS Research. Customer will not disclose the contents of the report, whether directly in any media or indirectly through incorporation in a database, marketing list, report or otherwise, or use or permit the use of Information to generate any statistical or other information that is or will be provided to third parties; or voluntarily produce Information in legal proceedings. Market reports are based on expectations, estimates and projections as of the date such information is available. Any recommendation contained in this report may not be suitable for all investors or businesses. The market conclusions drawn are necessarily based upon a number of estimates and assumptions that, while considered reasonable by BIS Research as of the date of such statements, are inherently subject to market fluctuations and business, economic and competitive uncertainties and contingencies. For more details regarding permission, please contact us: Email: sales@bisresearch.com Tel: +1 650 228 0182 www.bisresearch.com