Download
1 / 10
100 likes | 102 Vues
The largest share of the smart & intelligent pumps market by application is occupied by oil & gas industry segment, which is further expected to witness growth in leaps and bounds during the forecast period. The high market share of the segment is attributed to the high demand for energy efficient solutions, lowering carbon emissions and reducing downtime.

E N D
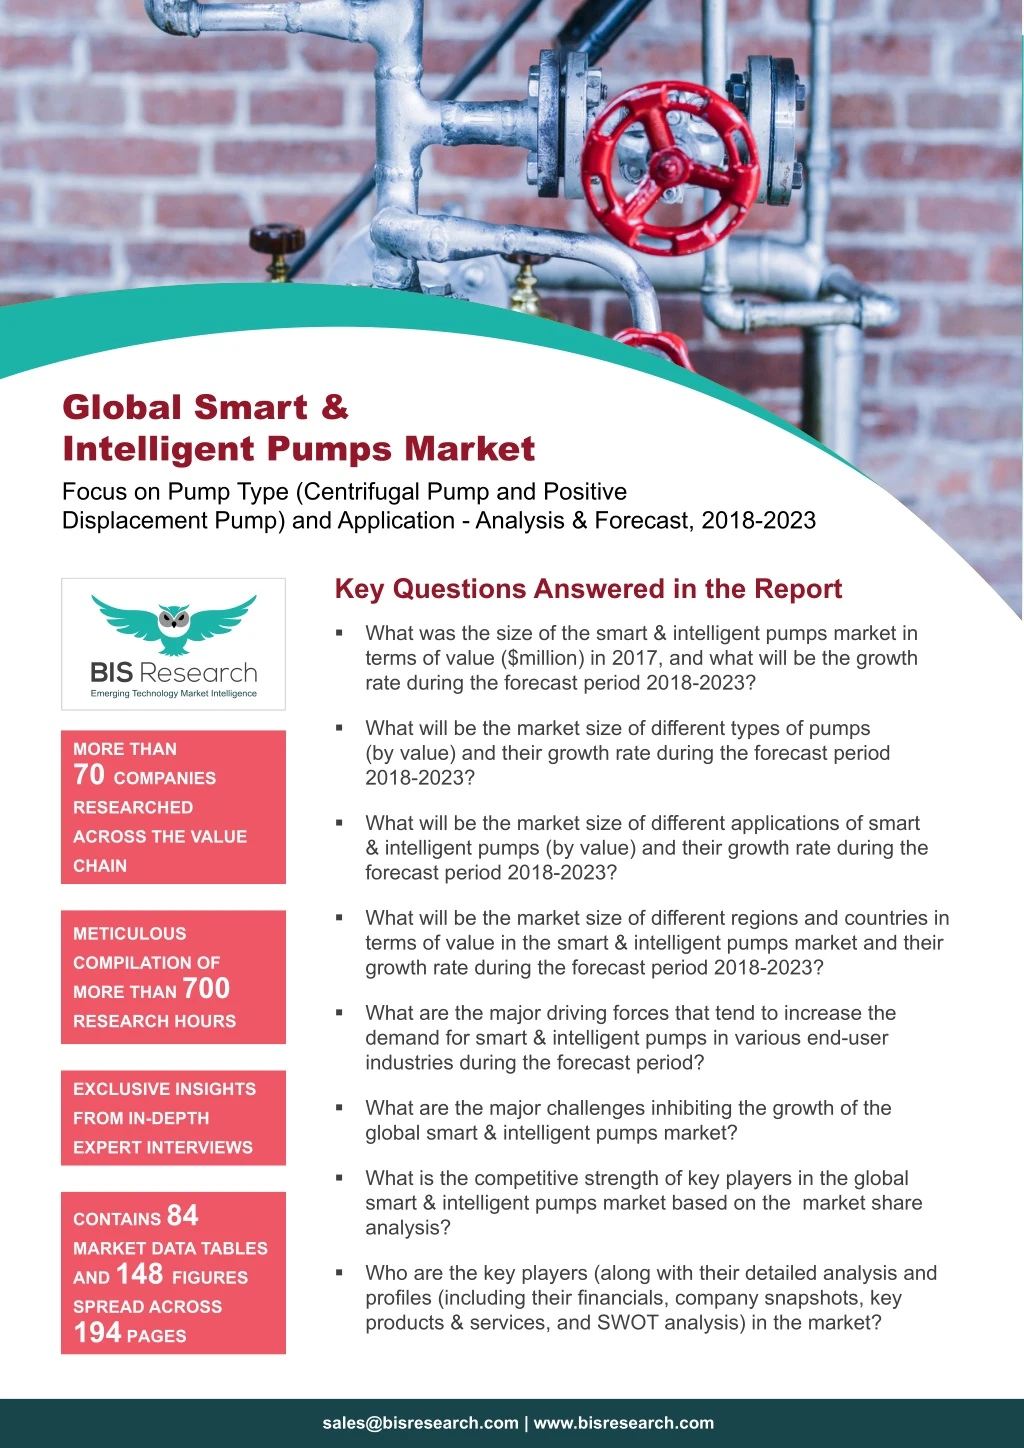
Global Smart & Intelligent Pumps Market Focus on Pump Type (Centrifugal Pump and Positive Displacement Pump) and Application - Analysis & Forecast, 2018-2023 Key Questions Answered in the Report What was the size of the smart & intelligent pumps market in terms of value ($million) in 2017, and what will be the growth rate during the forecast period 2018-2023? What will be the market size of different types of pumps (by value) and their growth rate during the forecast period 2018-2023? MORE THAN 70 COMPANIES RESEARCHED What will be the market size of different applications of smart & intelligent pumps (by value) and their growth rate during the forecast period 2018-2023? ACROSS THE VALUE CHAIN What will be the market size of different regions and countries in terms of value in the smart & intelligent pumps market and their growth rate during the forecast period 2018-2023? METICULOUS COMPILATION OF MORE THAN 700 RESEARCH HOURS What are the major driving forces that tend to increase the demand for smart & intelligent pumps in various end-user industries during the forecast period? EXCLUSIVE INSIGHTS What are the major challenges inhibiting the growth of the global smart & intelligent pumps market? FROM IN-DEPTH EXPERT INTERVIEWS What is the competitive strength of key players in the global smart & intelligent pumps market based on the market share analysis? CONTAINS 84 MARKET DATA TABLES AND 148FIGURES SPREAD ACROSS 194 PAGES Who are the key players (along with their detailed analysis and profiles (including their financials, company snapshots, key products & services, and SWOT analysis) in the market? sales@bisresearch.com | www.bisresearch.com
Table of Contents Overview Market Drivers Market Restraints Key Market Developments and Strategies Market Share Analysis R&D Analysis of Leading Players Supply Chain Analysis Industry Attractiveness Opportunity Matrix Analysis Country Share Analysis MARKET DYNAMICS COMPETITIVE INSIGHTS •Centrifugal Pump Positive Displacement Pump Oil & Gas Water & Wastewater Power Chemicals General Industry INDUSTRY ANALYSIS GLOBAL SMART & INTELLIGENT PUMPS MARKET (BY PUMP TYPE) North America Europe Asia-Pacific Middle East and Africa South America GLOBAL SMART & INTELLIGENT PUMPS MARKET (BY APPLICATION) GLOBAL SMART & INTELLIGENT PUMPS MARKET (BY REGION) Report Scope Global Smart & Intelligent Pumps Market Research Methodology Colfax Corporation Flowserve Corporation Grundfos Holding A/S GRUNWL ITT, Inc. Kirloskar Group KSB Group Pentair plc Regal Beloit Corporation SEEPEX GmbH Spirax-Sarco Engineering plc Sulzer Ltd. Wilo SE Xylem, Inc. Yaskawa Electric Corporation RESEARCH SCOPE AND METHODOLOGY COMPANY PROFILES VIEW COMPLETE TABLE OF CONTENT sales@bisresearch.com | www.bisresearch.com
List of Figures 1. Global Smart & Intelligent Pumps Market Snapshot, 2017-2023 Global Smart & Intelligent Pumps Market (by Pump Type), 2017 & 2023 Global Smart & Intelligent Pumps Market (by Application), 2017 & 2023 Global Smart & Intelligent Pumps Market Attractiveness Analysis (by Region), 2017-2023 Global Smart & Intelligent Pumps Market Concentration, 2017 Market Dynamics Strategies Adopted by the Key Players Percentage Share of Strategies Adopted by the Market Players, January 2015-October 2018 Product Launches by the Key Market Players, January 2015-October 2018 10. Mergers & Acquisitions by the Key Market Players, January 2015- October 2018 11. Business Expansion by the Key Market Players, January 2015- October 2018 12. Partnerships, Collaborations, and Joint Ventures by the Key Market Players, January 2015- October 2018 13. Others (Awards, Certifications, and Recognition by the Key Market Players, January 2015- October 2018 14. Global Smart & Intelligent Pumps Market Share Analysis, 2017 15. R&D Analysis of Leading Players, 2015-2017 16. Global Smart & Intelligent Pumps Market Supply Chain Analysis 17. Opportunity Analysis 18. Global Smart & Intelligent Pumps Porter’s Five Forces Analysis 19. Analyzing the Threat of New Entrants 20. Analyzing the Bargaining Power of Buyer 21. Analyzing the Bargaining Power of Suppliers 22. Analyzing Threat from Substitutes 23. Analyzing the Intensity of Competitive Rivalry 24. Global Smart & Intelligent Pumps Market (by Pump Type) 25. Global Smart & Intelligent Pumps Market, 2017-2023 26. Global Smart & Intelligent Pumps Market Attractiveness Analysis (by Pump Type), 2017-2023 27. Global Smart & Intelligent Pumps Market, by Centrifugal Pump Type, $Million, 2017-2023 28. Global Smart & Intelligent Pumps Market, by Positive Displacement Pump Type, $Million, 2017-2023 29. Global Smart & Intelligent Pumps Market (by Application) 30. Crude Oil Production in Key Regions, 2015-2017 31. Global Smart & Intelligent Pumps Market 32. Smart & Intelligent Pumps in Oil & Gas Industry, $Million, 2017-2023 33. Smart & Intelligent Pumps in Water & Wastewater Industry, $Million, 2017-2023 34. Smart & Intelligent Pumps in Power Industry, $Million, 2017-2023 35. Smart & Intelligent Pumps in Chemicals Industry, $Million, 2017-2023 36. Smart & Intelligent Pumps in General Industry, $Million, 2017-2023 37. Global Smart & Intelligent Pumps Market - Regional Segmentation 38. Asia-Pacific Smart & Intelligent Pumps Market (by Pump Type), 2017 & 2023 39. Asia-Pacific Smart & Intelligent Pumps Market (by Application), 2017 & 2023 40. Asia-Pacific Smart & Intelligent Pumps Market (by Country), Market Share Analysis, 2017 & 2023 41. China Smart & Intelligent Pumps Market, 2017-2023 42. Japan Smart & Intelligent Pumps Market, 2017-2023 43. India Smart & Intelligent Pumps Market, 2017-2023 44. Australia & New Zealand Smart & Intelligent Pumps Market, 2017-2023 45. South Korea Smart & Intelligent Pumps Market, 2017-2023 46. Rest-of-Asia-Pacific Smart & Intelligent Pumps Market, 2017-2023 47. Europe Smart & Intelligent Pumps Market (by Pump Type), 2017 & 2023 48. Europe Smart & Intelligent Pumps Market(by Application), 2017 & 2023 49. Europe Smart & Intelligent Pumps Market(by Country), Market Share Analysis, 2017 & 2023 50. The U.K. Smart & Intelligent Pumps Market, 2017-2023 51. Germany Smart & Intelligent Pumps Market, 2017-2023 52. France Smart & Intelligent Pumps Market, 2017-2023 53. Italy Smart & Intelligent Pumps Market, 2017-2023 54. Russia Smart & Intelligent Pumps Market, 2017-2023 55. Rest-of-Europe Smart & Intelligent Pumps Market, 2017-2023 56. North America Smart & Intelligent Pumps Market (by Pump Type), 2017 & 2023 57. North America Smart & Intelligent Pumps Market (by Application), 2017 & 2023 . 2. 3. 4. 5. 6. 7. 8. 9. sales@bisresearch.com | www.bisresearch.com
List of Figures 58. North America Smart & Intelligent Pumps Market (by Country), Market Share Analysis, 2017 & 2023 59. The U.S. Smart & Intelligent Pumps Market, 2017-2023 60. Canada Smart & Intelligent Pumps Market, 2017-2023 61. Mexico Smart & Intelligent Pumps Market, 2017-2023 62. MEA Smart & Intelligent Pumps Market (by Pump Type), 2017 & 2023 63. MEA Smart & Intelligent Pumps Market (by Application), 2017 & 2023 64. MEA Smart & Intelligent Pumps Market (by Country), Market Share Analysis, 2017 & 2023 65. The U.A.E. Smart & Intelligent Pumps Market, 2017-2023 66. Global Smart & Intelligent Pumps Market 67. Saudi Arabia Smart & Intelligent Pumps Market, 2017-2023 68. South Africa Smart & Intelligent Pumps Market, 2017-2023 69. Iran Smart & Intelligent Pumps Market, 2017-2023 70. Rest-of-MEA Smart & Intelligent Pumps Market, 2017-2023 . 71. South America Smart & Intelligent Pumps Market (by Pump Type), 2017 & 2023 . 72. South America Smart & Intelligent Pumps Market (by Application), 2017 & 2023 73. South America Smart & Intelligent Pumps Market (by Country), Market Share Analysis, 2017 & 2023 74. Brazil Smart & Intelligent Pumps Market, 2017-2023 75. Colombia Smart & Intelligent Pumps Market, 2017-2023 76. Argentina Smart & Intelligent Pumps Market, 2017-2023 77. Rest-of-South-America Smart & Intelligent Pumps Market, 2017-2023 . 78. Share of Key Players 79. Colfax Corporation: Product Portfolio 80. Colfax Corporation: Overall Financials, 2015-2017 81. Colfax Corporation: Net Revenue (by Business Segments), 2015-2017 82. Colfax Corporation: SWOT Analysis 83. Flowserve Corporation: Product Portfolio ... 84. Flowserve Corporation: Overall Financials, 2015-2017 85. Flowserve Corporation: Net Revenue (by Business Segments), 2015-2017 86. Flowserve Corporation: Net Revenue (by Region), 2015-2017 87. Flowserve Corporation: SWOT Analysis 88. Grundfos Holding A/S: Product Portfolio 89. Grundfos Holding A/S: Overall Financials, 2015-2017 90. Grundfos Holding A/S: Net Revenue (by Region), 2015-2017 91. Grundfos Holding A/S: SWOT Analysis 92. GRUNWL: Product Portfolio 93. GRUNWL: SWOT Analysis 94. ITT, Inc.: Product Portfolio 95. ITT, Inc.: Overall Financials, 2015-2017 96. ITT, Inc.: Net Revenue (by Business Segments), 2015-2017 97. ITT, Inc.: Net Revenue (by Region), 2015-2017 98. ITT, Inc.: SWOT Analysis 99. Kirloskar Group: Product Portfolio 100. Kirloskar Group: Overall Financials, 2015-2017 101. Kirloskar Group: SWOT Analysis 102. KSB Group: Product Portfolio 103. Global Smart & Intelligent Pumps Market 104. KSB Group: Overall Financials, 2015-2017 105. KSB Group: Net Revenue (by Business Segment), 2015-2017 106. KSB Group: SWOT Analysis 107. Pentair plc: Product Portfolio 108. Pentair plc: Overall Financials, 2015-2017 109. Pentair plc: Net Revenue (by Business cccccSegments), 2015-2017 110. Pentair plc: Net Revenue (by Region), 2015-2017 111. Pentair plc: SWOT Analysis 112. Regal Beloit Corporation: Product Portfolio 113. Regal Beloit Corporation: Overall Financials, 2015-2017 114. Regal Beloit Corporation: Net Revenue (by Business Segments), 2015-2017 115. Regal Beloit Corporation: SWOT Analysis 116. SEEPEX GmbH: Product Portfolio 117. SEEPEX GmbH: SWOT Analysis 118. Spirax-Sarco Engineering plc: Product Portfolio 119. Spirax-Sarco Engineering plc: Overall Financials, 2015-2017 120. Spirax-Sarco Engineering plc: Net Revenue (by Region), 2015-2017 121. Spirax-Sarco Engineering plc: SWOT Analysis 122. Sulzer Ltd: Product Portfolio 123. Sulzer Ltd: Overall Financials, 2015-2017 sales@bisresearch.com | www.bisresearch.com
List of Figures 124. Sulzer Ltd: Net Revenue (by Business Segments), 2016-2017 125. Sulzer Ltd: Net Revenue (by Region), 2016-2017 126. Sulzer Ltd: SWOT Analysis 127. Wilo SE: Product Portfolio 128. Wilo SE: Overall Financials, 2015-2017 129. Wilo SE: Net Revenue (by Business Segments), 2016-2017 130. Wilo SE: Net Revenue (by Region), 2016-2017 131. Wilo SE: SWOT Analysis 132. Xylem, Inc.: Product Portfolio 133. Xylem, Inc.: Overall Financials, 2015-2017 134. Xylem, Inc.: Net Revenue (by Business Segments), 2015-2017 135. Xylem, Inc.: Net Revenue (by Region), 2015-2017 136. Xylem, Inc.: SWOT Analysis 137. Yaskawa Electric Corporation: Product Portfolio 138. Yaskawa Electric Corporation: Overall Financials, 2015-2017 139. Yaskawa Electric Corporation: Net Revenue (by Business Segments), 2015-2017 140. Yaskawa Electric Corporation: Net Revenue (by Region), 2015-2017 141. Yaskawa Electric Corporation: SWOT Analysis 142. Global Smart & Intelligent Pumps Market 143. Global Smart & Intelligent Pumps Market Scope 144. Report Design 145. Primary Interviews (by Player, Designation, and Region) 146. Sources of Secondary Research 147. Data Triangulation 148. Top-Down & Bottom-Up Approach sales@bisresearch.com | www.bisresearch.com
List of Tables 1. Comparative Analysis of Standard and Smart & Intelligent Pumps 22. South Korea Smart & Intelligent Pumps Market (by Pump Type), $Million, 2017-2023 2. Global Smart & Intelligent Pumps Market Key Findings, 2017 & 2023 23. South Korea Smart & Intelligent Pumps Market (by Application), $Million, 2017-2023 3. Market Dynamics: Impact Analysis 24. Rest-of-Asia-Pacific Smart & Intelligent Pumps Market (by Pump Type), $Million, 2017-2023 4. List of Potential Entrants in the Smart & Intelligent Pumps Market 25. Rest-of-Asia-Pacific Smart & Intelligent Pumps Market (by Application), $Million, 2017-2023 5. Global Smart & Intelligent Pumps Market (by Pump Type), $Million, 2017-2023 26. Europe Smart & Intelligent Pumps Market (by Pump Type), $Million, 2017-2023 6. Intelligent Pumps- Comparison 27. Global Smart & Intelligent Pumps Market 7. Smart & Intelligent Pumps Market (by Oil & Gas Industry Sub-Applications), $Million, 2017-2023 28. Europe Smart & Intelligent Pumps Market (by Application), $Million, 2017-2023 8. Smart & Intelligent Pumps Market (by Water & Wastewater Industry Sub-Applications), $Million, 2017-2023 29. Europe Smart & Intelligent Pumps Market (by Oil & Gas Industry Sub-Applications), $Million, 2017-2023 9. Asia-Pacific Smart & Intelligent Pumps Market (by Pump Type), $Million, 2017-2023 30. Europe Smart & Intelligent Pumps Market (by Water & Wastewater Industry Sub-Applications), $Million, 2017-2023 10. Asia-Pacific Smart & Intelligent Pumps Market (by Application), $Million, 2017-2023 31. Europe Smart & Intelligent Pumps Market (by Country), $Million, 2017-2023 11. Asia-Pacific Smart & Intelligent Pumps Market (by Oil & Gas Industry Sub-Applications), $Million, 2017-2023 32. The U.K. Smart & Intelligent Pumps Market (by Pump Type), $Million, 2017-2023 12. Asia-Pacific Smart & Intelligent Pumps Market (by Water & Wastewater Industry Sub-Applications), $Million, 2017-2023 33. The U.K. Smart & Intelligent Pumps Market (by Application), $Million, 2017-2023 13. Asia-Pacific Smart & Intelligent Pumps Market (by Country), $Million, 2017-2023 34. Germany Smart & Intelligent Pumps Market (by Pump Type), $Million, 2017-2023 14. China Smart & Intelligent Pumps Market (by Pump Type), $Million, 2017-2023 35. Germany Smart & Intelligent Pumps Market (by Application), $Million, 2017-2023 15. China Smart & Intelligent Pumps Market (by Application), $Million, 2017-2023 36. France Smart & Intelligent Pumps Market (by Pump Type), $Million, 2017-2023 16. Japan Smart & Intelligent Pumps Market (by Pump Type), $Million, 2017-2023 37. France Smart & Intelligent Pumps Market (by Application), $Million, 2017-2023 17. Japan Smart & Intelligent Pumps Market (by Application), $Million, 2017-2023 38. Italy Smart & Intelligent Pumps Market (by Pump Type), $Million, 2017-2023 18. India Smart & Intelligent Pumps Market (by Pump Type), $Million, 2017-2023 39. Italy Smart & Intelligent Pumps Market (by Application), $Million, 2017-2023 19. India Smart & Intelligent Pumps Market (by Application), $Million, 2017-2023 40. Russia Smart & Intelligent Pumps Market (by Pump Type), $Million, 2017-2023 20. Australia & New Zealand Smart & Intelligent Pumps Market (by Pump Type), $Million, 2017-2023 41. Russia Smart & Intelligent Pumps Market (by Application), $Million, 2017-2023 21. Australia & New Zealand Smart & Intelligent Pumps Market (by Application), $Million, 2017-2023 42. Rest-of-Europe Smart & Intelligent Pumps Market (by Pump Type), $Million, 2017-2023 sales@bisresearch.com | www.bisresearch.com
List of Tables 43. Rest-of-Europe Smart & Intelligent Pumps Market (by Application), $Million, 2017-2023 64. Saudi Arabia Smart & Intelligent Pumps Market (by Application), $Million, 2017-2023 44. North America Smart & Intelligent Pumps Market (by Pump Type), $Million, 2017-2023 65. South Africa Smart & Intelligent Pumps Market (by Pump Type), $Million, 2017-2023 45. North America Smart & Intelligent Pumps Market (by Application), $Million, 2017-2023 66. South Africa Smart & Intelligent Pumps Market (by Application), $Million, 2017-2023 46. North America Smart & Intelligent Pumps Market (by Oil & Gas Industry Sub-Applications), $Million, 2017-2023 67. Iran Smart & Intelligent Pumps Market (by Pump Type), $Million, 2017-2023 68. Iran Smart & Intelligent Pumps Market (by Application), $Million, 2017-2023 47. North America Smart & Intelligent Pumps Market (by Water & Wastewater Industry Sub-Applications), $Million, 2017-2023 69. Rest-of-MEA Smart & Intelligent Pumps Market (by Pump Type), $Million, 2017-2023 48. North America Smart & Intelligent Pumps Market (by Country), $Million, 2017-2023 70. Rest-of-MEA Smart & Intelligent Pumps Market (by Application), $Million, 2017-2023 49. The U.S. Smart & Intelligent Pumps Market (by Pump Type), $Million, 2017-2023 71. South America Smart & Intelligent Pumps Market (by Pump Type), $Million, 2017-2023 50. The U.S. Smart & Intelligent Pumps Market (by Application), $Million, 2017-2023 72. South America Smart & Intelligent Pumps Market (by Application), $Million, 2017-2023 51. Canada Smart & Intelligent Pumps Market (by Pump Type), $Million, 2017-2023 73. South America Smart & Intelligent Pumps Market (by Oil & Gas Industry Sub-Applications), $Million, 2017-2023 52. Canada Smart & Intelligent Pumps Market (by Application), $Million, 2017-2023 74. South America Smart & Intelligent Pumps Market (by Water & Wastewater Industry Sub-Applications), $Million, 2017-2023 53. Global Smart & Intelligent Pumps Market 54. Mexico Smart & Intelligent Pumps Market (by Pump Type), $Million, 2017-2023 75. South America Smart & Intelligent Pumps Market (by Country), $Million, 2017-2023 55. Mexico Smart & Intelligent Pumps Market (by Application), $Million, 2017-2023 76. Brazil Smart & Intelligent Pumps Market (by Pump Type), $Million, 2017-2023 56. MEA Smart & Intelligent Pumps Market (by Pump Type), $Million, 2017-2023 77. Brazil Smart & Intelligent Pumps Market (by Application), $Million, 2017-2023 57. MEA Smart & Intelligent Pumps Market (by Application), $Million, 2017-2023 78. Colombia Smart & Intelligent Pumps Market (by Pump Type), $Million, 2017-2023 58. MEA Smart & Intelligent Pumps Market (by Oil & Gas Industry Sub-Applications), $Million, 2017-2023 79. Global Smart & Intelligent Pumps Market 80. Colombia Smart & Intelligent Pumps Market (by Application), $Million, 2017-2023 59. MEA Smart & Intelligent Pumps Market (by Water & Wastewater Industry Sub-Applications), $Million, 2017-2023 81. Argentina Smart & Intelligent Pumps Market (by Pump Type), $Million, 2017-2023 60. MEA Smart & Intelligent Pumps Market (by Country), $Million, 2017-2023 82. Argentina Smart & Intelligent Pumps Market (by Application), $Million, 2017-2023 61. The U.A.E. Smart & Intelligent Pumps Market (by Pump Type), $Million, 2017-2023 83. Rest-of-South-America Smart & Intelligent Pumps Market (by Pump Type), $Million, 2017-2023 62. The U.A.E. Smart & Intelligent Pumps Market (by Application), $Million, 2017-2023 84. Rest-of-South-America Smart & Intelligent Pumps Market (by Application), $Million, 2017-2023 63. Saudi Arabia Smart & Intelligent Pumps Market (by Pump Type), $Million, 2017-2023 sales@bisresearch.com | www.bisresearch.com
Research Scope & BIS Methodology 1. Scope of the Report This report is intended to be a comprehensive study of the global smart & intelligent pumps market. The report focuses largely on providing market information for smart & intelligent pumps, covering different segments including pump type, application, and country. Further, the forecast period considered for the market estimation given in the different sections of the report is from 2018 to 2023. 2. Global Smart & Intelligent Pumps Market Research Methodology The research methodology design adopted for this specific study includes a mix of data collected from the primary and secondary sources. The research exhaustively uses both the primary sources (in-house experts, industry leaders, and market players) and the secondary sources (a host of paid and unpaid databases) along with analytical tools to build the forecast and predictive models. Primary Data Sources The primary sources involve the industry experts from the smart & intelligent pumps market including suppliers, manufacturers, distributors, administrators, solution providers, and technology developers related to the various segments of the industry’s value chain. Primary sources, such as CEOs, vice presidents, marketing directors, and technology directors, among others, have been interviewed to obtain and verify both qualitative and quantitative aspects of this research study. The key data points taken from the primary sources include: Validation and triangulation of all the numbers and graphs Validation of report segmentation and key qualitative findings Understanding the competitive landscape Validation of the number of various markets for different pump types and applications Percentage split for different regions Secondary Data Sources In the extensive secondary research process for this study, more than hundreds of secondary sources, such as certified publications, articles from recognized authors, white papers, annual reports of companies, gold & silver standard websites, directories, and major databases, have been used to identify and collect information to analyze the market from both from the qualitative and quantitative standpoints. The following figure exhibits the key secondary data sources considered for this research study: sales@bisresearch.com | www.bisresearch.com
Figure: Secondary Data Sources BIS Research Internal Repository Key Players Competitive Landscape Opportunities/Challenges Market Size and Market Share (YEAR) Macro Pactors Market estimates Country-Wise Analysis Bis Research Internal Repository DATA TRIANGULATION Primary Sources Secondary Sources Primary Sources Secondary Sources Demand Side Demand Side Interview With: End-User Applications • Oil & Gas • Water & Wastewater • Power • Chemicals • General Industry R&D & Other Manufacturers Supply Side Pump Associations Annual Reports of Key Industrial Players SEC Filings 10K Reports Investor Presentations Analyst Presentations Journals Press Releases Paid & Unpaid Databases Interview With: Senior Managements of Major Companies In the Smart & Intelligent Pumps Market Tier II Players Distributors Retailers Senior Management of Major Companies in the Manufacturing of Smart & Intelligent Pumps Source: BIS Research Analysis. REQUEST FOR SAMPLE
BIS Research 39111 Paseo Padre PKWY STE 313, Fremont CA 94538-1686, Tel: +1-510-404-8135 Global Delivery Centre Tapasya Corp Heights, Subarea, Sector 126, Noida, NCR-201303 India Tel: +91 120 4261540 / +91 120 4261544 To know more about us, please visit our website: bisresearch.com For other queries contact: sales@bisresearch.com