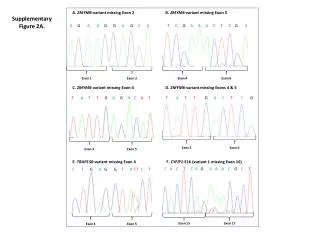
Analysis of HBV Variant Populations and Response to Treatment
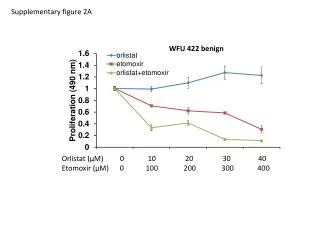
Examination of HBV DNA levels and variant populations in response to treatment with relevant mutation proportions for A181V and N236T.

Analysis of HBV Variant Populations and Response to Treatment
E N D
Presentation Transcript
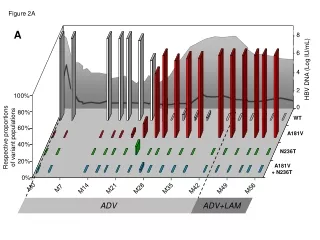
Figure 2A A 8 6 HBV DNA (Log IU/mL) 4 2 100% 0 80% WT 60% Respective proportionsof variant populations A181V 40% N236T 20% A181V + N236T 0% M0 M7 M14 M28 M35 M21 M42 M49 M56 ADV ADV+LAM
Figure 2B 10 B 8 6 HBV DNA Log IU/mL 4 2 0 100% WT 80% A181V 60% Respective proportionsof variant populations N236T 40% A181V + N236T 20% A181T + N236T 0% M0 M5 M10 M15 M20 M25 M30 M35 M40 M45 ADV ADV+LAM
Figure 2C 10 C 8 6 HBV DNA Log IU/mL 4 2 0 100% WT 80% A181V Respective proportionsof variant populations 60% A181T 40% N236T 20% A181V + N236T 0% M0 M5 M10 M15 M20 M25 M30 M35 M40 M45 ADV
8 D 6 HBV DNA (Log IU/mL) 4 2 100% 0 WT 80% A181V Respective proportionsof variant populations 60% A181T 40% N236T A181V+ N236T 20% A181T + N236T 0% M0 M5 M10 M15 M20 M25 ADV Figure 2D
Figure 2E 8 E 6 HBV DNA (Log IU/mL) 4 2 0 100% WT 80% A181V 60% Respective proportionsof variant populations N236T 40% A181V + N236T 20% A181T + N236T 0% M0 M7 M14 M21 M28 M35 M42 ADV+LAM ADV ADV
Figure 2F F 8 6 HBV DNA (Log IU/mL) 4 2 0 100% WT 80% A181V 60% Respective proportionsof variant populations N236T 40% A181V + N236T 20% A181T + N236T 0% ADV M0 M10 M20 M30 M40 M50 ADV
Figure 2G G 10 8 HBV DNA (Log IU/mL) 6 4 2 100% 0 WT 80% A181V 60% Respective proportionsof variant populations 40% A181T 20% N236T 0% M0 M7 M21 M42 M48 M28 M35 M14 ADV ADV ADV+LAM