Britton Stephens – NCAR
The Vertical Distribution of Atmospheric CO 2 and the Latitudinal Partitioning of Global Carbon Fluxes. Britton Stephens – NCAR

Britton Stephens – NCAR
E N D
Presentation Transcript
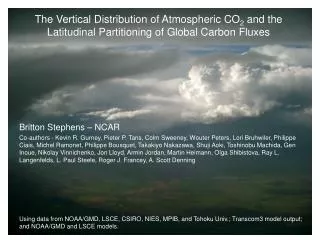
The Vertical Distribution of Atmospheric CO2 and the Latitudinal Partitioning of Global Carbon Fluxes Britton Stephens – NCAR Co-authors - Kevin R. Gurney, Pieter P. Tans, Colm Sweeney, Wouter Peters, Lori Bruhwiler, Philippe Ciais, Michel Ramonet, Philippe Bousquet, Takakiyo Nakazawa, Shuji Aoki, Toshinobu Machida, Gen Inoue, Nikolay Vinnichenko, Jon Lloyd, Armin Jordan, Martin Heimann, Olga Shibistova, Ray L. Langenfelds, L. Paul Steele, Roger J. Francey, A. Scott Denning Using data from NOAA/GMD, LSCE, CSIRO, NIES, MPIB, and Tohoku Univ.; Transcom3 model output; and NOAA/GMD and LSCE models.
TransCom3 model results based on surface data imply a large transfer of carbon from tropical to northern land regions. Level 1 (annual mean) Level 2 (seasonal) Gurney et al, Nature, 2002 Gurney et al, GBC, 2004
Impact on predicted fluxes TransCom3 predicted rectifier effects explain most of the variability in estimated fluxes. Response to neutral biosphere flux
Map of airborne flask sampling locations Northern Hemisphere sites include Briggsdale, Colorado, USA (CAR); Estevan Point, British Columbia, Canada (ESP); Molokai Island, Hawaii, USA (HAA); Harvard Forest, Massachusetts, USA (HFM); Park Falls, Wisconsin, USA (LEF); Poker Flat, Alaska, USA (PFA); Orleans, France (ORL); Sendai/Fukuoka, Japan (SEN); Surgut, Russia (SUR); and Zotino, Russia (ZOT). Southern Hemisphere sites include Rarotonga, Cook Islands (RTA) and Bass Strait/Cape Grim, Australia (AIA).
Midday vertical CO2 profiles measured at 12 locations Based on fits to samples binned by altitude and averaged over different seasonal intervals. A smoothed deseasonalized record from Mauna Loa has been subtracted from the observations at each site. Black lines in each panel represent northern-hemisphere average profiles for the same times. The x-axis in B is zoomed by a factor of 2 relative to that in A and C.
Observed and predicted northern-hemisphere average profiles Model output was processed in the same way as the observations at each site before averaging. Symbols indicate 1 km and 4 km values used for calculating vertical gradients. The x-axis in B is zoomed by a factor of 2 relative to that in A and C.
Northern-land and tropical-land estimated fluxes as a function of the models’ predicted vertical CO2 gradients Estimated by the 12 T3L2 models for the 1992 to 1996 time period. The x-axis represents the predicted northern-hemisphere vertical CO2 difference between 1 km and 4 km altitude at these same times. Gray bars indicate the observed vertical CO2 gradient and uncertainties.
Observational and modeling biases evaluated using complementary data sets and models: • Interlaboratory calibration offsets and measurement errors • Diurnal biases • Interannual variations and long-term trends • Flight-day weather bias • Spatial and Temporal Representativeness
3 models that most closely reproduce the observed annual-mean vertical CO2 gradients (4, 5, and C): • northern land uptake = -1.5 ± 0.6 PgCyr-1 • tropical land emission = +0.1 ± 0.8 PgCyr-1 • All model average: • northern land uptake = -2.4 ± 1.1 PgCyr-1 • tropical land emission = +1.8 ± 1.7 PgCyr-1 Conclusions: Models with large tropical sources and large northern uptake are inconsistent with observed vertical gradients. A global budget with less tropical north carbon transfer is also more consistent with bottom-up estimates.