Download
1 / 32
320 likes | 338 Vues
This study aims to improve pedestrian safety and minimize risk by identifying, developing, deploying, and evaluating various countermeasures in the Las Vegas metro area. The study includes before and after studies, comparative studies, data collection, and statistical analyses to measure the effectiveness of different countermeasures.

E N D
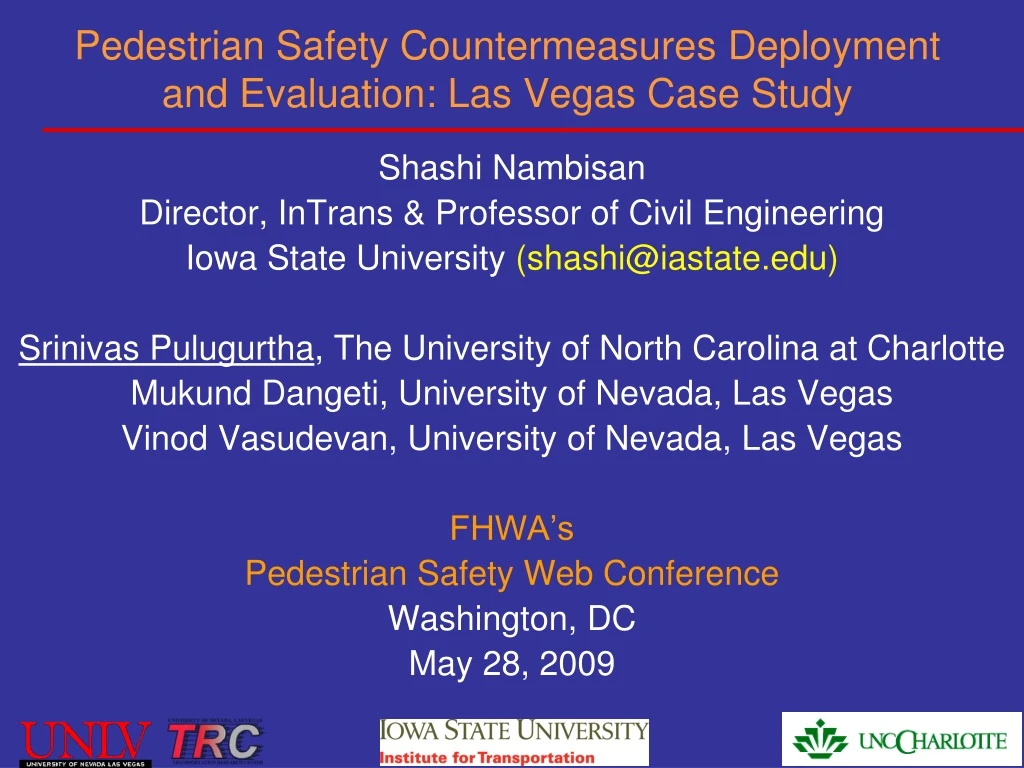
Pedestrian Safety Countermeasures Deployment and Evaluation: Las Vegas Case Study Shashi Nambisan Director, InTrans & Professor of Civil Engineering Iowa State University (shashi@iastate.edu) Srinivas Pulugurtha, The University of North Carolina at Charlotte Mukund Dangeti, University of Nevada, Las Vegas Vinod Vasudevan, University of Nevada, Las Vegas FHWA’s Pedestrian Safety Web Conference Washington, DC May 28, 2009
Goals • Improve pedestrian safety, minimize risk • Identify, develop, deploy, and evaluate countermeasures • Case Study: Las Vegas metro area, Nevada
Introduction • Significant growth for 20+ years • Wide, fast street grid network • High posted & operational vehicle speeds • Widely used transit system • High risk conditions for pedestrians • Demographics • Population ~ 1.8 million • Diversity: age, race • 85 percent of the crashes involved locals
Methodology • Identify candidate locations • GIS based analysis • Site characteristics • Problem characteristics • Develop, deploy, & evaluate countermeasures • Measures of effectiveness
Study Design • Before and after Studies • Comparative studies (with control group) • Data collection ( ~18,000 pedestrians) • Statistical analyses • Parametric • Non-parametric
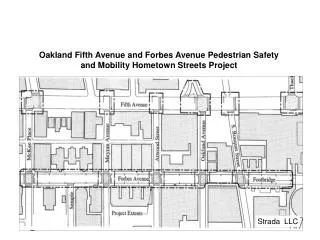
Study Locations • Top priority / high risk locations • Crash index and crash rank • Site selection: 18 locations • Includes 4 control locations • Excluded the resort Corridor (The “Strip” and its proximity) • Different jurisdictions • City of Las Vegas • City of North Las Vegas • Clark County • Nevada Dept of Transportation (State)
Selection of Countermeasures • Site characteristics • Geometric conditions • Operating conditions • Light conditions • Demographics • Land-use • Costs
Countermeasures • Engineering based countermeasures • ITS based countermeasures • Others
Measures of Effectiveness / Statistical Tests 23 • Pedestrian • Using the crosswalk • Captured / diverted • Looking for cars before crossing • Trapped in the middle of the street • Pedestrian-vehicle Conflicts • Pedestrian waiting for signal to cross • Delay • Driver • Yielding behavior, distance • Blocking crosswalk • Speed
Speed Trailer and Vehicle Speeds 25 64.3kph 54.6kph 51.3 kph 50.7kph
30 Countermeasures with Low Effectiveness
Summary Significant overall benefits Pedestrian Driver Permitting & deployment considerations Administrative / jurisdictional hurdles Vendor / procurement difficulties Education needs: pedestrians, motorists 31
Acknowledgments US Dept of Transp., Federal Highway Admin Nevada Dept of Transportation Nevada Office of Traffic Safety Regional Transp Commission of So. Nevada Clark County, Nevada City of Las Vegas UNLV TRC: students, staff 32