Download
1 / 40
400 likes | 504 Vues
Measurement of Spin Correlations in ttbar events in the dilepton channel at 7 TeV. Thomas Speer (Brown University), Felix Hohle (RWTH), Jeremy Andrea (IPHC, Strasbourg), Kelly Beermaert (Ghent), Heiko Geenen (RWTH), Haryo Sumowidadgo (RiverSide), Efe Yazgan(Ghent)

E N D
Measurement of Spin Correlations in ttbar events in the dilepton channel at 7 TeV Thomas Speer (Brown University), Felix Hohle (RWTH), Jeremy Andrea (IPHC, Strasbourg), Kelly Beermaert (Ghent), Heiko Geenen (RWTH), Haryo Sumowidadgo (RiverSide), Efe Yazgan(Ghent) D. Barge, C. Campagnari, D. Kovalskyi, V. Krutelyov (UCSB)W. Andrews, G. Cerati, D. Evans, F. Golf, I. MacNeill, S. Padhi, Y. Tu, F. Wuerthwein, A. Yagil, J. Yoo (UCSD)L. Bauerdick, K. Burkett, I. Fisk, Y. Gao, O. Gutsche, B. Hooberman, S. Jindariani, J. Linacre, V. Martinez Outschoorn (FNAL)
PAS and Talks Talks by Jeremy Andrea: https://indico.cern.ch/getFile.py/access?contribId=5&resId=0&materialId=slides&confId=187624 https://indico.cern.ch/getFile.py/access?contribId=4&resId=0&materialId=slides&confId=191553 Talks by Sergo Jindariani, Jacob Linacre and Yanjun Tu https://indico.cern.ch/getFile.py/access?contribId=1&resId=0&materialId=slides&confId=180584 http://indico.cern.ch/getFile.py/access?contribId=8&sessionId=0&resId=0&materialId=slides&confId=180655 http://indico.cern.ch/getFile.py/access? contribId=1&resId=0&materialId=slides&confId=187624 https://indico.cern.ch/getFile.py/access?contribId=2&resId=0&materialId=slides&confId=190610 https://indico.cern.ch/getFile.py/access?contribId=3&resId=0&materialId=slides&confId=191553
Introduction and Motivation • The SM predicts a correlation between the spins of top and anti-top quark in top quark pair production. • Sensitive to new physics in both production and decay mechanism. • Two analyses in dilepton channel: • Measure the spin correlations using dilepton azimuthal opening angle (Deltaphi), which can be compared directly with the ATLAS result (http://arxiv.org/abs/arXiv:1203.4081v1). • Measure asymmetries related to the spin correlation in both the inclusive region and the high mass region (M_ttbar > 450 GeV) • using Deltaphi, as the above • by full reconstruction of the dilepton event kinematics.
Event selection (inclusive) • black color: common for two analyses; green color: spin correlation measurement; blue color: asymmetry measurement • Event cleaning: if >= 10 tracks; at least 25% purity; at least 1 good DA vertex (not isFake, ndf > 4, rho < 2 cm, z < 24 cm) • 2 opposite sign isolated leptons: pT > 20 GeV, |eta| < 2.5 (2.1 or 2.4) for e (µ) • ≥2 pf jets with pT > 30 GeV, |eta| < 2.5 • loose pfjet ID (L1FastL2L3 corrected) • ∆R > 0.4 from all leptons passing analysis selection • ≥1b tags: CSVL orCSVM (tighter requirement which suppresses DY significantly) • MET > 40 GeV (ee and mm) or > 30 GeV in all 3 channels • Z veto: 76<mll<106 GeV veto (for SF leptons) • mll>20 GeV or 12 GeV to veto low mass resonances (SF leptons)
Deltaphi Analysis In PAS • The azimuthal opening angle between two leptons from the decay of top quark pair (Mahlon & Parke, PRD 81, 074024). • Fit data to templates made of ttbar MC sample with and without spin correlation, and background.
Dataset, MC Sample, and Selection • Use the dataset, trigger, selection, and background estimation as the TOP-11-005 dilepton cross-section / TOP-11-016 AMWT mass analysis. • Correspond to 5.0/fb of data. • MC sample with and without spin correlation are generated with MC@NLO. • Simulation is done with FastSim. • Extensive comparison and cross-checks were done between FastSim & FullSim.
Analysis Method • Fit deltaphi in 3 channels separately using 3 templates: ttbar with & w/o spin correlation, background. • Extract the fraction on ttbar with spin correlation (SM). 9
Fit Procedure • Fit parameters: • Nee, Nmumu, Nemu, fSM. • Ratio of ttbar w/ and w/o spin corrrelation • Background normalization is fixed. • Fit using RooFit • Nsig, Nbkg, PDFcorr, PDFnocorr, and PDFbkg are different for each of the 3 channels. • fSM is identical for all 3 channels.
Calibration and Linearity Check (i) • Using pseudoexperiment, vary the fraction of ttbar corr. & uncorr. in the pseudodata, and check the extracted fraction from the fit. • No bias is observed.
Calibration and Linearity Check (ii) • A pull width of 0.91 is observed. The fit uncertainty thus is adjusted, taken into account the pull.
Calibration and Linearity Check (iii) • Pull distribution after the uncertainty correction.
Fit Result • fSM : 0.74 ± 0.07 (stat).Nee: 1726 ± 44Nmumu: 2153 ± 50Nemu: 6404 ± 84 • Spin correlation coefficient isA = ASM × fSM= 0.23 ± 0.02 (stat) • Right: data and fit results in the combined channel. In PAS
Data-driven BG estimates: DY and Fakes • DY • Fakes in AN-12-151, using the matrix method from ttbar cross section measurement. • Fakes in AN-12-190, using the data driven tight-to-loose method described in AN-2012/257 • Results are in the back-up slides.
Systematic Uncertainties • Estimated from pseudo-experiments. • Pseudo-data are constructed using templates with variation of the systematics under study. Difference of the mean of the pseudo-data distribution with the nominal fit value is taken as systematic. • Systematics Uncertainties Considered • Lepton isolation, identification, and energy scale. • Jet energy scale and resolution. • B-tagging. • Background normalization. • Generator: Compare MC@NLO & POWHEG • Hadronization & Fragmentation: POWHEG+Herwig & POWHEG+Pythia. • Top quark mass. • Parton Distribution Function.
Table of Systematic Uncertainties The MC samples needed for the missing systematics are done (see back up slides)
Measure Asymmetries • We measure the following asymmetry variables in the dilepton final states, inspired by this theory paper: http://arxiv.org/abs/1105.3743 by D. Krohn, T. Liu, J. Shelton, L.T. Wang • lepton azimuthal angle asymmetry (does not require top reco) • top spin correlation variable using full reco of the dilepton event kinematics: product of the polarizations of the top and anti-top • Any significant differences from the SM expectation could be a signal of new physics
Reco Asymmetries in the Inclusive Region Statistical uncertainty only Pythia-powheg ttbar sample is used and the ttbar yields is normalized such that the total MC yields equal data yields. The reconstructed asymmetries are consistent with the SM prediction.
Unfolded Asymmetries in the Inclusive Region PAS PAS PAS The unfolded asymmetries are consistent with the SM prediction
Reco Asymmetries in High Mass Region (M_tt>450 GeV) PAS PAS PAS No significant discrepancy is observed compared to the SM prediction in the high mass region
Systematics PAS
Conclusions • We performed the analyses which measure the spin correlation and the asymmetries related to the spin correlation. • The spin correlation measured using Deltaphi in the helicity basis is found to be 0.23±0.02±X. • The asymmetries related to the spin correlation using Deltaphi or by full reconstruction of the dilepton event kinematics are measured in both the inclusive region and the high mass region (M_ttbar > 450 GeV). The results are consistent with the SM prediction. No evidence for NP is found.
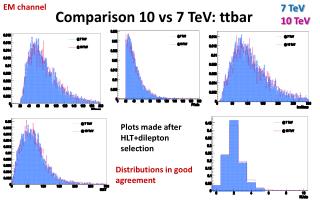
Data-MC comparison • We compare data to sum of MC in the preselection region, using the 3 different ttbar samples for the ttbar->dilepton component • TTJets_TuneZ2_7TeV-madgraph-tauola:madgraph sample, no spin correlations between top and tbar • TTTo2L2Nu2B_7TeV-powheg-pythia6: powheg dilepton sample, with spin correlations • TT_TuneZ2_7TeV-mcatnlo: MC@NLO sample, with spin correlations • All other background samples (including tt->other) are kept the same • All distributions are normalized to unity (shape comparison only) • asymmetry measurements are only sensitive to the shape • K-S calculated using bins of 0.2* plotted width
Summary for the Shape Comparison • Asymmetry values and K-S vs data, for preselection region • for variables requiring top reconstruction, only events with solution are used • powheg dilepton ttbar sample seems to best represent the data for these variables
Reconstruction of Top kinematics • In dilepton channel, each event yields two neutrinos. • There is an ambiguity of combining b-jets and leptons from the same top quark. • It is a challenge to reconstruct top mass in the dilepton channel. • We currently use the analytical matrix weighting technique (AMWT) described in http://arxiv.org/abs/arXiv:1105.5661 • Each events is reconstructed using a series of input M_top values between 100-300 GeV with one GeV step. • In order to determine a preferred value of M_top, a weight is assigned to each solution. For each event, the M_top hypothesis with the maximum averaged weight (over solutions) is taken as the reconstructed top mass. • Events without solutions are discarded.
Reconstructed Top Mass About 17% events without solutions. Looks reasonably well
Data-driven BG estimates: DY • Estimate for high region: 47.6 ± 10.6 events (stat. uncertainty only) • consistent with MC predictions of 39.9 ± 4.8 events • Estimate for inclusive region: 142.4 ± 15.0 events (stat. uncertainty only) • consistent with MC prediction 126.7 ± 8.7 events
Data-driven BG estimates: Fakes • Estimate for high mass region: 45.9 +108.5-45.9 events (stat. uncertainty only) • consistent with MC prediction of 47.1 ± 5.4 events • Estimate for inclusive region: 138 + 281-138 events (stat. uncertainty only) • consistent with MC prediction 100.1 ± 6.7 events