Download
1 / 21
210 likes | 323 Vues
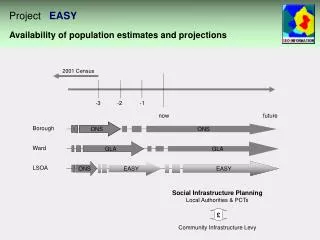
This document provides an overview of the General Register Office for Scotland's (GROS) household estimates and projections, including their purpose, methodology, and significance for local authorities. It details the types of statistics produced, the geographic and demographic categories considered, and how projections are generated every two years to forecast household composition over 25 years. GROS projections inform decisions on housing needs and services, and the document also highlights tools for accessing and interpreting these statistics, including small area statistics and local authority projections.

E N D
Household Estimates and Projections Esther Roughsedge General Register Office for Scotland Household estimates and projections branch Centre for Housing Market Analysis Statistics Training 29 January 2009
Background • Housing Need & Demand Assessment Guidance (HNDA) 2008 refers to GROS household projections and small area statistics. • I’ll cover: • What statistics we produce which may be of use • Results • How to access and interpret our statistics
Purpose of GROS household projections • Mainly used to inform local authority decisions about future housing and service need • Need to know projected number of households, and type. • GROS produces projections in a consistent way across the country. • Some areas produce their own local projections. These can be used where this can be justified.
How they are produced • Produced every 2 years, to cover a 25-year period. • Based on population projections; • Subtract communal establishment population; • Project household composition information from the 1991 + 2001 Censuses.
Categories used • Geographies: • 32 local authorities in Scotland • 2 National Parks • 4 Strategic Development Plan Areas (coming soon!) • 7 household types: • 10 age groups for the head of household:
Projected percentage change in households, 2006-2031 Wide geographic variation
High migration variants • We have also produced LA projections which incorporate higher projected migration. • Areas with highest in-migration are most affected, e.g., Aberdeen and Edinburgh. • Migrants tend to be younger, so the biggest impact on household structure is in households with children (assuming the migrants stay and have families here).
Projections for different areas • GROS produces projections for Councils, National Parks and Strategic Development Plan Areas. • Software such as Popgroup/Housegroup exists, which some councils use to produce their own projections for small areas, or using different assumptions. • We are working to support councils in using this. • Note: projections for smaller areas will be less reliable.
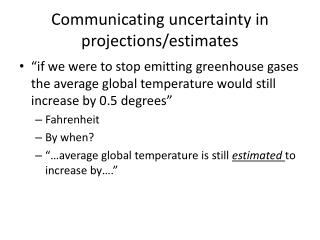
Interpreting household projections • GROS projections are based on past trends. • They don’t take account of: • Future policy initiatives • Economic predictions • Planned housing developments • Potential discrepancies between housing supply and demand
Scottish Neighbourhood Statistics • We also publish small area statistics on housing and households on www.sns.gov.uk: • Number of dwellings • Council Tax band • Type of dwelling • Number of rooms per dwelling • Density of housing • % occupied • % vacant • % second homes • Data comes from Council Tax information. • Published annually, along with summary LA publication.
Other neighbourhood statistics data available • Population (by age and gender) • Deprivation • Housing • Physical environment • Health • Access to services • Economic activity, benefits & tax credits • Community care • Geographic classifications • etc
Feel free to contact us! • Household estimates and projections: www.gro-scotland.gov.uk/statistics/household-estimates-projections/index.html • Scottish Neighbourhood Statistics: www.sns.gov.uk • Esther Roughsedge 0131-3144-251
Net vs. gross household formation • HNDA asks ‘How many newly arising households are likely to be in housing needs each year?’. • Need figures on newly-formed households, which GROS projections don’t provide. • Glen Bramley’s affordable housing needs study contains figures for each LA – shows an average of 2.4% of households are newly-formed. • We are working on another method based on DCLG guidance. Initial results suggest that the figures are similar.