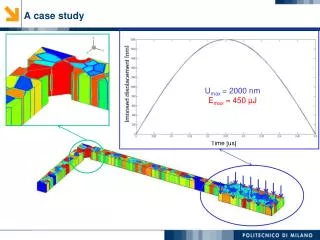
A CASE STUDY
A CASE STUDY. Section 3. Overview In this section we will show the negative consequences of the lack of coordination in a large scale machine We analyze the behavior of a complex scientific application representative of the ASCI workload on a large scale supercomputer


A CASE STUDY
E N D
Presentation Transcript
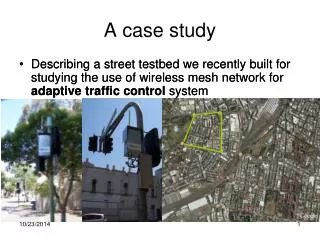
Section 3 • Overview • In this section we will show the negative consequences of the lack of coordination in a large scale machine • We analyze the behavior of a complex scientific application representative of the ASCI workload on a large scale supercomputer • A case study that emphasizes the importance of the coordination in the network and in the system software
ASCI Q • 2,048 ES45 Alphaservers, with 4 processors/node • 16 GB of memory per node • 8,192 processors in total • 2 independent network rails, Quadrics Elan3 • > 8192 cables • 20 Tflops peak, #2 in the top 500 lists • A complex human artifact
Dealing with the complexity of a real system • In this section of the tutorial we provide insight into our methodology, that we used to substantially improve the performance of ASCI Q. • This methodology is based on an arsenal of • analytical models • custom microbenchmarks • full applications • discrete event simulators • Dealing with the complexity of the machine and the complexity of a real parallel application, SAGE, with > 150,000 lines of Fortran & MPI code
Overview • Our performance expectations for ASCI Q and the reality • Identification of performance factors • Application performance and breakdown into components • Detailed examination of system effects • A methodology to identify operating systems effects • Effect of scaling – up to 2000 nodes/ 8000 processors • Quantification of the impact • Towards the elimination of overheads • demonstrated over 2x performance improvement • Generalization of our results: application resonance • Bottom line: the importance of the integration of the various system across nodes
Performance of SAGE on 1024 nodes There is a difference why ? • Performance consistent across QA and QB (the two segments of ASCI Q, with 1024 nodes/4096 processors each) • Measured time 2x greater than model (4096 PEs) Lower is better!
Using fewer PEs per Node Test performance using 1,2,3 and 4 PEs per node Lower is better!
Using fewer PEs per node (2) Measurements match model almost exactly for 1,2 and 3 PEs per node! Performance issue only occurs when using 4 PEs per node
Mystery #1 SAGE performs significantly worse on ASCI Q than was predicted by our model
SAGE performance components • Look at SAGE in terms of main components: • Put/Get (point-to-point boundary exchange) • Collectives (allreduce, broadcast, reduction) Performance issue seems to occur only on collective operations
Performance of the collectives Allreduce Latency 3 1 process per node 2 processes per node 2.5 3 processes per node 2 Latency ms 1.5 1 0.5 0 0 100 200 300 400 500 600 700 800 900 1000 Nodes • Measure collective performance separately 4 processes per node • Collectives (e.g., allreduce and barrier) mirror the performance of the application
Identifying the problem within Sage Sage Simplify Allreduce
Exposing the problems with simple benchmarks Allreduce Challenge: identify the simplest benchmark that exposes the problem Add complexity Benchmarks
Interconnection network and communication libraries • The initial (obvious) suspects were the interconnection network and the MPI implementation • We tested in depth the network, the low level transmission protocols and several allreduce algorithms • We also implemented allreduce in the Network Interface Card • By changing the synchronization mechanism we were able to reduce the latency of an allreduce benchmark by a factor of 7 • But we only got small improvements in Sage (5%)
Mystery #2 Although SAGE spends half of its time in allreduce (at 4,096 processors), making allreduce 7 times faster leads to a small performance improvement
Computational noise • After having ruled out the network and MPI we focused our attention on the compute nodes • Our hypothesis is that the computational noise is generated inside the processing nodes • This noise “freezes” a running process for a certain amount of time and generates a “computational” hole
Computational noise: intuition • The computation of one process is interrupted by an external event (e.g., system daemon or kernel) P P P P 2 0 1 3 • Running 4 processes on all 4 processors of an Alphaserver ES45
Computational noise: 3 processes on 3 processors • The “noise” can run on the 4th processor without interrupting the other 3 processes P P P 2 0 1 • Running 3 processes on 3 processors of an Alphaserver ES45 IDLE
Coarse grained measurement • We execute a computational loop for 1,000 seconds on all 4,096 processors of QB START END P 1 P 2 P 3 P 4 TIME
Coarse grained computational overhead per process • The slowdown per process is small, between 1% and 2.5% lower is better
Mystery #3 Although the “noise” hypothesis could explain SAGE’s suboptimal performance, the microbenchmarks of per-processor noise indicate that at most 2.5% of performance is lost to noise
Fine grained measurement • We run the same benchmark for 1000 seconds, but we measure the run time every millisecond • Fine granularity representative of many ASCI codes
Fine grained computational overhead per node • We now compute the slowdown per-node, rather than per-process • The noise has a clear, per cluster, structure Optimum is 0 (lower is better)
Finding #1 Analyzing noise on a per-node basis reveals a regular structure across nodes
Noise in a 32 Node Cluster • The Q machine is organized in 32 node clusters (TruCluster) • In each cluster there is a cluster manager (node 0), a quorum node (node 1) and the RMS data collection (node 31)
Per node noise distribution • Plot distribution of one million, 1 ms computational chunks • In an ideal, noiseless, machine the distribution graph is • a single bar at 1 ms of 1 million points per process (4 million per node) • Every outlier identifies a computation that was delayed by external interference • We show the distributions for the standard cluster node, and also nodes 0, 1 and 31
Cluster Node (2-30) • 10% of the times the execution of the 1 ms chunk of computation is delayed
Node 0, Cluster Manager • We can identify 4 main sources of noise
Node 1, Quorum Node • One source of heavyweight noise (335 ms!)
Node 31 • Many fine grained interruptions, between 6 and 8 milliseconds
The effect of the noise . . . . . . . . . . . . . . . . . . . . . . . . . . . • An application is usually a sequence of a computation followed by a synchronization (collective): • But if an event happens on a single node then it can affect all the other nodes
Effect of System Size . . . . . . . . . . . . • The probability of a random event occurring increases with the node count.
Tolerating Noise: Buffered Coscheduling (BCS) . . . . . . . . . . . . . . . . . . . . . . . . We can tolerate the noise by coscheduling the activities of the system software on each node
Discrete Event Simulator:used to model noise • DES used to examine and identify impact of noise: takes as input the harmonics that characterize the noise • Noise model closely approximates experimental data • The primary bottleneck is the fine-grained noise generated by the compute nodes (Tru64) Lower is better
Finding #2 On fine-grained applications, more performance is lost to short but frequent noise on all nodes than to long but less frequent noise on just a few nodes
Incremental noise reduction • removed about 10 daemons from all nodes (including: envmod, insightd, snmpd, lpd, niff) • decreased RMS monitoring frequency by a factor of 2 on each node (from an interval of 30s to 60s) • moved several daemons from nodes 1 and 2 to node 0 on each cluster.
Resulting SAGE Performance • Nodes 0 and 31 also configured out in the optimization
Finding #3 We were able to double SAGE’s performance by selectively removing noise caused by several types of system activities
Generalizing our results:application resonance • The computational granularity of a balanced bulk-synchronous application correlates to the type of noise. • Intuition: • any noise source has a negative impact, a few noise sources tend to have a major impact on a given application. • Rule of thumb: • the computational granularity of the application “enters in resonance” with the noise of the same order of magnitude • The performance can be enhanced by selectively removing sources of noise • We can provide a reasonable estimate of the performance improvement knowing the computational granularity of a given application.
Cumulative Noise Distribution, Sequence of Barriers with No Computation • Most of the latency is generated by the fine-grained, high-frequency noisie of the cluster nodes
Conclusions • Combination of Measurement, Simulation and Modeling to • Identify and resolve performance issues on Q • Used modeling to determine that a problem exists • Developed computation kernels to quantify O/S events: • Effect increases with the number of nodes • Impact is determined by the computation granularity in an application • Application performance has significantly improved • Method also being applied to other large-systems