Multitrait Scaling and IRT: Part I
200 likes | 376 Vues
Multitrait Scaling and IRT: Part I. Ron D. Hays, Ph.D. (drhays@ucla.edu) http://www.gim.med.ucla.edu/FacultyPages/Hays/ Questionnaire Design and Testing Workshop 2 nd Floor Conference Room November 10, 2008, 3-5pm. Multitrait Scaling Analysis. • Internal consistency reliability

Multitrait Scaling and IRT: Part I
E N D
Presentation Transcript
Multitrait Scaling and IRT: Part I Ron D. Hays, Ph.D. (drhays@ucla.edu) http://www.gim.med.ucla.edu/FacultyPages/Hays/ Questionnaire Design and Testing Workshop 2nd Floor Conference Room November 10, 2008, 3-5pm
Multitrait Scaling Analysis • Internal consistency reliability – Item convergence • Item discrimination
Measurement Error observed = true score systematic error random error + + (bias)
Cronbach’s Alpha 01 55 02 45 03 42 04 35 05 22 Respondents (BMS) 4 11.6 2.9 Items (JMS) 1 0.1 0.1 Resp. x Items (EMS) 4 4.4 1.1 Total 9 16.1 Source SS MS df 2.9 - 1.1 = 1.8 = 0.62 Alpha = 2.9 2.9
Alpha for Different Numbers of Itemsand Homogeneity Average Inter-item Correlation ( r ) Number of Items (k) .0 .2 .4 .6 .8 1.0 2 .000 .333 .572 .750 .889 1.000 4 .000 .500 .727 .857 .941 1.000 6 .000 .600 .800 .900 .960 1.000 8 .000 .666 .842 .924 .970 1.000 Alphast = k * r 1 + (k -1) * r
Spearman-Brown Prophecy Formula ) ( N • alpha x alpha = y 1 + (N - 1) * alpha x N = how much longer scale y is than scale x
Example Spearman-Brown Calculations MHI-18 18/32 (0.98) (1+(18/32 –1)*0.98 = 0.55125/0.57125 = 0.96
Number of Items and Reliability for Three Versions of the Mental Health Inventory (MHI)
Reliability Minimum Standards • 0.70 or above (for group comparisons) • 0.90 or higher (for individual assessment) • SEM = SD (1- reliability)1/2
Multitrait/Multi-Item CorrelationMatrix for Patient Satisfaction Ratings Technical Interpersonal Communication Financial Technical 1 0.66* 0.63† 0.67† 0.28 2 0.55* 0.54† 0.50† 0.25 3 0.48* 0.410.44† 0.26 4 0.59* 0.53 0.56† 0.26 5 0.55* 0.60† 0.56† 0.16 6 0.59* 0.58† 0.57† 0.23 Interpersonal 1 0.58 0.68* 0.63† 0.24 2 0.59† 0.58* 0.61† 0.18 3 0.62† 0.65* 0.67† 0.19 4 0.53† 0.57* 0.60† 0.32 5 0.54 0.62* 0.58† 0.18 6 0.48† 0.48* 0.46† 0.24 Note – Standard error of correlation is 0.03. Technical = satisfaction with technical quality. Interpersonal = satisfaction with the interpersonal aspects. Communication = satisfaction with communication. Financial = satisfaction with financial arrangements. *Item-scale correlations for hypothesized scales (corrected for item overlap). †Correlation within two standard errors of the correlation of the item with its hypothesized scale.
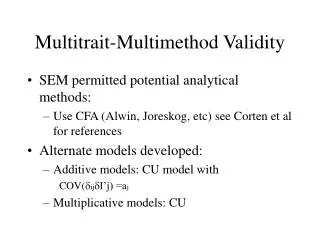
Confirmatory Factor Analysis • Compares observed covariances with covariances generated by hypothesized model • Statistical and practical tests of fit • Factor loadings • Correlations between factors • Regression coefficients
Fit Indices 2 2 - • Normed fit index: • Non-normed fit index: • Comparative fit index: null model 2 2 2 null - model null df df null model 2 null - 1 df null 2 -df 1 - model model 2 - df null null
P(X1=1) 1 Item 1 Response P(X1=0) 0 P(X2=1) 1 Latent Trait Item 2 Response P(X2=0) 0 P(X3=0) 0 Item 3 Response P(X3=1) 1 P(X3=2) 2 Latent Trait and Item Responses
Person 1 Person 2 Person 3 Trait Continuum Item 1 Item 2 Item 3 Item Responses and Trait Levels
Item Response Theory (IRT) IRT models the relationship between a person’s response Yi to the question (i) and his or her level of the latent construct being measured by positing bik estimates how difficult it is for the item (i) to have a score of k or more and the discrimination parameter ai estimates the discriminatory power of the item. If for one group versus another at the same level we observe systematically different probabilities of scoring k or above then we will say that the item i displays DIF
PROMIS Assessment Center • http://www.nihpromis.org/ • http://www.assessmentcenter.net/ac1/