Download
1 / 47
520 likes | 897 Vues
This comprehensive guide explores how radiation interacts with vegetation, soil, and rocks through absorption, transmission, and reflection processes. Learn about the electromagnetic spectrum, spectral signatures, and how to differentiate materials using multispectral data in remote sensing applications.

E N D
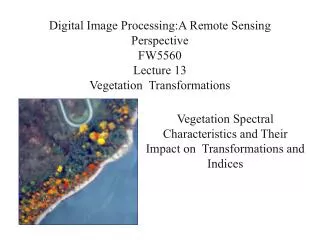
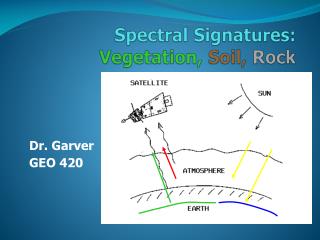
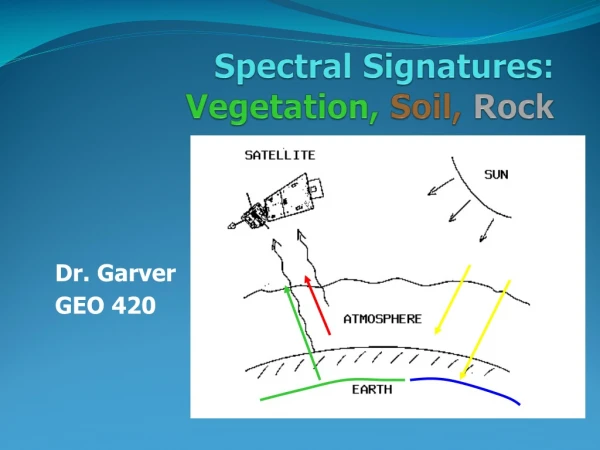
Spectral Signatures: Vegetation, Soil, Rock Dr. Garver GEO 420
Radiation that reaches that surface interacts with targets in 3 ways: Absorption(A), transmission(T), reflection (R).
Absorption(A) Transmission(T) Reflection (R). Proportions of each depends on l of energy and what the target is.
Reflection (R) - radiation "bounces" off target and is redirected. Radiation reflected from targets is what we are most interested in.Two types - Specular reflection and Diffuse reflection. Represents the two extreme ends of the way in which energy is reflected from a target.
Smooth surface (road) - specular or mirror-like reflection where all (or almost all) of energy is directed away from surface in a single direction. Rough surface (tree) - diffuse reflection occurs, energy is reflected almost uniformly in all directions.Most earth surface features lie somewhere between, depends on the surface roughness of the feature in comparison to the wavelength of the incoming radiation.
Electromagnetic Spectrum: Spectral Signatures • For any material, the amount of solar radiation that it reflects, absorbs, transmits, or emits varies with wavelength. • When that amount (usually represented as a %) coming from the material is plotted over a range of wavelengths, the connected points produce a curve called the material's spectralsignature(spectral response curve).
Spectral Signatures Plot variations of reflected EMR as a function of wavelength. Identify and separate different materials using multispectral data.
Visible (Vis) 0.4. – 0.7 mm • Near Infrared (NIR) 0.7 – 1.3 mm • Shortwave Infrared (SWIR) 1.3 – 3.0 mm
General example of a reflectance plot for some (unspecified) vegetation type with the dominating factor influencing each interval of the curve indicated:
Vegetation • Visible - Chlorophyll absorption in blue and red, reflection in green. • Near IR (0.7 – 1.3 um) – reflectance increases dramatically, plant leaf reflects 40 – 50%, absorption is minimal so remainder is transmitted. • Reflection is due to the internal structure of plants. • Allows discrimination of species • Plant stresses – alters reflection
Vegetation • SWIR (1.3 – 3.0mm) - incident energy is absorbed or reflected, little is transmitted. • Water absorption bands in this range
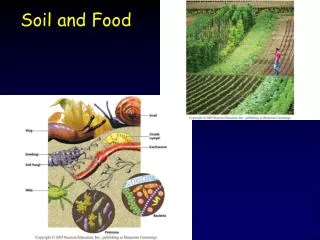
Soil • Considerably less peak and valley variations in reflectance. • Factors that influence soil reflectance act over less specific spectral bands. • Factors – moisture, soil texture, organic matter, iron oxide.
Water • Most distinctive characteristic is absorption at near IR and beyond. • Delineate water bodies using near IR • But look at water quality/clarity/biology in the visible
Water: Longer l visible and near IR absorbed, reflectance of blue or blue-green
Water and vegetation may reflect somewhat similarly in the visible wavelengths but are almostalways separable in the infrared.
The spectral response for inorganic materials is distinct from vegetation types.
Gradual rise in reflectance with increasing wavelengths. • Concrete, light-colored and bright, has higher % refl than dark asphalt.
Refl for veg. rises abruptly at ~0.7 µm, followed by a gradual drop at about 1.1 µm. 0.3 - 0.5 µm - most veg. types similar in response 0.5 - 0.6 µm moderate variations 0.7 - 0.9 µm - maximum variability (optimum discrimination)
SENSOR SUN REFL GREEN GREEN RED NIR HIGHLY REFL NIR BLUE Sensors operating in green, red, and near IR candiscriminate absorption and reflectance of vegetation.
Absorption in red & blue by chlorophyll pigments. • Reflectance concentrated in the green. • Thus, most vegetation has a green-leafy color.
Strong reflectance between 0.7 and 1.0 µm (near IR) in cells located in the interior or back of a leaf. • Intensity of this reflectance is greater than from most inorganic materials. • So, vegetation appears bright in the near-IR
Near Infrared Composite (4,3,2) • Adding near infrared (NIR) band, drop visible blue band
Landsat Thematic Mapper BLUE(0.45-0.52 µm): water penetration, soil/veg. discrimination. GREEN (0.52-0.60 µm): green reflectance peak for discrimination and vigor assessment. RED (0.63-0.69 µm): chlorophyll absorption for species differentiation. NEAR IR (0.76-0.90 µm): determining vegetation types, vigor, and biomass content, delineating water bodies, soil moisture.
One of the most successful applications of multispectral space imagery is monitoring the state of the world's agricultural production. • Major crops: wheat, barley, millet, oats, corn, soybeans, rice.
4 spectral curves • Variations in depths of absorption bands.
If the spectral curves are so similar, how can we hope to distinguish them in the field? • Characteristic leaf or frond shape will differ geometrically from most other types. • Oat hay and potato as crops are clearly dissimilar in the way they look in bulk. • Combination of spectral response and diversity of shape produce slightly different signatures, mainly in the depth of any absorption features.
Some crops distinguishable by separations in 0.56 to 0.66 µm interval.
San Joaquin Valley – July 1972 - barley, alfalfa, sugar beets, beans, tomatoes, cotton.Yellow-brown and blue areas flanking Valley crops are grasslands and chapparal.Blue areas – Stockton/Modesto.
Spectral signatures for healthy, stressed, and severely stressed vegetation. • Visible-spectral signatures similar. • Near-infrared -spectral signatures very different. • Healthy vegetation - highest reflectance • Severely stressed vegetation - lowest reflectance.
Which region of the spectrum shows the greatest reflectance for; • grasslands • pinewoods • red sand • silty water
Spectral Signatures of 4 Materials Band 1 = 0.55 um Band 2 = 0.85 um • Vis 0.4. – 0.7 mm • NIR 0.7 – 1.3 mm • SWIR 1.3 – 3.0 mm
Different materials, amount of solar radiation that it reflects, absorbs, or transmits varies with wavelength. Important property of matter, makes it possible to identify different substances, or classes, and separate them by their spectralsignatures.
Method for measuring differences Use reflectance differences to distinguish the four common surface materials Plot the reflectance percentages of the 4 classes at two wavelengths where there is maximum differences observed in the spectral signatures.
Spectral Signatures of 4 Materials Band 1 = 0.55 um Band 2 = 0.85 um • Vis 0.4. – 0.7 mm • NIR 0.7 – 1.3 mm • SWIR 1.3 – 3.0 mm
GL = grasslandsPW = pinewoods RS = red sandSW = silty water