Download
1 / 21
210 likes | 363 Vues
Warm Up # 1. The perimeter of a rectangle is 32. The length is 1 more than twic e the width. What are the dimensions of the rectangle? Solve the system: . Homework Check . Essential Question. How can we represent the solution to a system of linear inequalities?. Graphing Linear

E N D
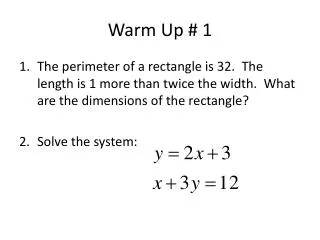
Warm Up # 1 • The perimeter of a rectangle is 32. The length is 1 more than twice the width. What are the dimensions of the rectangle? • Solve the system:
Essential Question How can we represent the solution to a system of linear inequalities?
Graphing Linear Inequalities
We show the solution to a linear inequality with a graph. Step 1) Put the inequalities into slope-intercept form. y = mx + b slope y-intercept
Step 2) Graph the line • If the inequality is < or >, make the lines dotted. • If the inequality is < or >, make the lines solid.
Step 3) Shade the correct region of the graph: • Above the line b) Below the line for y > or y . for y < or y ≤. **This is because more then 1 ordered pair can be a solution!
Examples: 1) y > -5x + 4
Examples: 2) x < 4 3) y ≥ -3
Systems of Inequalities
We show the solution to a system of linear inequalities with a graph!
Steps to Graphing a System of Inequalities: • Put the inequalities into slope-intercept form. • Decide if the lines should be dotted or solid • Shade above for y > or y , shade below for y < or y ≤. • Shade the overlapping section darker to show where the solutions to both inequalities lie.
Example #1: a: 3x + 4y > - 4 b: x + 2y < 2 Put in Slope-Intercept Form:
Example, continued: a: dotted shade above b: dotted shade below Graph each line, make dotted or solid and shade the correct area.
#2 Graph the system of linear inequalities. x³ –1 y> x – 2
#5 x – y > 3 7x – y ≤ -3
#6 7x + 2y < -10 -x + 2y ≤ 11
Classwork: Solving Systems of Inequalities Worksheet Homework: Unit 7 TEST -