Download

1 / 30
690 likes | 1.91k Vues
Economics of Information. Overview. Economics of Search & Relevance of Advertisement for Search and Experience Goods Quality Uncertainty and the Market for Lemons: Problem of Adverse Selection Market Signaling Moral Hazard – Examples of Increased Disability Payments, and Medicare & Medicaid

E N D
Overview • Economics of Search & Relevance of Advertisement for Search and Experience Goods • Quality Uncertainty and the Market for Lemons: Problem of Adverse Selection • Market Signaling • Moral Hazard – Examples of Increased Disability Payments, and Medicare & Medicaid • The Principal-Agent Problem • Managerial Incentives in an Integrated Firm • Asymmetric Information in Labor Markets: Efficiency Wage Theory
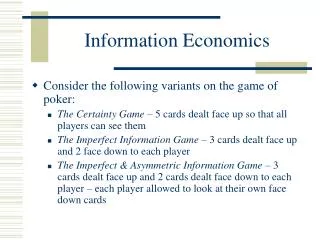
Economics of Search • What are search costs & how do they arise? • Can there be price dispersion even in a standardized market? Why? • If consumers decide on search based on MB=MC, why should search increase with the increasing convenience of internet? • Why do customers invest differently in search cost even if objective benefits are the same? • Example of searching for a minimum price: Expected price = lowest price + (price range)/(1 + # of searches) => Expected price = f (lowest P, price range, # of searches) (+) (+) (-) • Note: Addition of unity in denominator leading expected price to fall less and less with more searches
Re-examining Role of Ad for Search & Experience Goods • Search goods (e.g., fresh fruits, vegetables): Quality can be evaluated through inspection at purchase time; hence Ad must have large informational content & may be self-defeating. • Experience goods (e.g., TV, automobiles, computers, canned food, laundry detergent): Quality known through use & thus brand name developed; hence Ad provides indirect support for seller’s claims. • If higher than average Ad budget means relatively less price increase & higher rate of output increase, it confirms large informational content of Ad. • Sometimes the seller announces lowest possible price (i.e., no-haggling value pricing) to avoid buyer’s bargaining over price and thus eliminating buyer’s search cost.
Quality Uncertaintyand the Market for Lemons • The lack of complete information when purchasing a used car increases the risk of the purchase and lowers the value of the car. • The Market for Used Cars: • If buyers and sellers can distinguish between high and low quality cars, there will be practically two different markets for two related (presumably still imperfectly substitute) products
The market for high and low quality cars when buyers and sellers can identify each car With asymmetric information buyers will find it difficult to determine quality. They lower their expectations of the average quality of used cars. Demand for low and high quality used cars shifts to DM. SH The increase in QLreduces expectations and demand to DLM. The adjustment process continues until demand = DL.for both types of cars 10,000 DH SL DM 5,000 DM DLM DLM DL DL 25,000 50,000 50,000 75,000 The Lemons Problem PH PL 1 1 2 2 QH QL
Quality Uncertaintyand the Market for Lemons • The Market for Used Cars • With asymmetric information: • Low quality goods drive high quality goods out of the market. • The market has failed to produce mutually beneficial trade. • Too many low and too few high quality cars are on the market. • Adverse selection occurs; the only cars on the market will be low quality cars. • More Examples: Gresham’s Law – Bad money (with intrinsic value < face value) throwing out good money
Example of Asymmetric Information: The Market for Medical Insurance • Is it possible for insurance companies to separate high and low risk policy holders? • If not, only high risk people will purchase insurance. • Adverse selection would make medical insurance unprofitable. • What impact does asymmetric information and adverse selection have on insurance rates and the delivery of automobile accident insurance? • How to avoid market failure due to adverse selection? • Compulsory medical checkup, different premiums for different age groups & occupations, different rates of coinsurance, deductibility & length of contract, sharing health history etc. • Otherwise universal, government-provided, compulsory health insurance.
Another Example: The Market for Credit & Role of Screening • Asymmetric information creates the potential that only high risk borrowers will seek loans. • Questions: • How can credit histories help make this market more efficient and reduce the cost of credit? • Can credit rationing, forcing market to close at below market-clearing price, help?
Implications of Asymmetric Information: Importance of Reputation and Standardization • Asymmetric Information and Daily Market Decisions • Ratings by ‘Better Business Bureau’ • San Francisco’s Forty Niners’ Football Team • Retail sales • Antiques, art, rare coins • Home repairs • Restaurants
Implications of Asymmetric Information: More Insights • Question: How can these producers provide high-quality goods when asymmetric information will drive out high-quality goods through adverse selection? • Answer: Reputation • Question: Why do you look forward to a Big Mac when traveling, even though you would never consider buying one at home? • Holiday Inn once advertised“No Surprises”to address the issue of adverse selection.
Market Signaling • The process of sellers using signals to convey information to buyers about the product’s quality helps buyers and sellers deal with asymmetric information. • Strong Signal • To be effective, a signal must be easier for high quality sellers to give than low quality sellers. • Example • Highly productive workers signal with educational attainment level.
A Simple Model of Job Market Signaling • Assume Two groups of workers • Group I: Low productivity--AP & MP = 1 • Group II: High productivity--AP & MP = 2 • The workers are equally divided between Group I and Group II--AP for all workers = 1.5 • Assume Competitive Product Market • P = $10,000 • Employees average 10 years of employment • Group I Revenue = $100,000 (10,000/yr. x 10) • Group II Revenue = $200,000 (20,000/yr. X 10) • With Complete Information • w = VMPL • Group I wage = $10,000/yr. • Group II wage = $20,000/yr. • With Asymmetric Information • w = average productivity • Group I & II wage = $15,000
Signaling With Education to Reduce Asymmetric Information • y = education index (years of higher education) • C = cost of attaining educational level y • Group I--CI(y) = $40,000y • Group II--CII(y) = $20,000y • Assume education does not increase productivity • Decision Rule: • y* signals GII and wage = $20,000 • Below y* signals GI and wage = $10,000
CI(y) = $40,000y CII(y) = $20,000y Optimal choice of y for Group I Optimal choice of y for Group I Signaling • Benefits = $100,000 • Cost CII(y)= 20,000y • => Choose y* if • $100,000<$20,000y* • =>y* < 5 • Benefits = $100,000 • Cost CI(y) = 40,000y • => Choose no education if • $100,000<$40,000y* • =>y* > 2.5 Value of College Educ. Value of College Educ. $200K $200K $100K $100K B(y) B(y) 0 1 2 3 4 5 6 0 1 2 3 4 5 6 Years of College Years of College y* y*
Cost/Benefit Comparison • Decision rule works if y* is between 2.5 and 5 • If y* = 4 • Group I would choose no school • Group II would choose y* • Rule discriminates correctly • Education thus provides a useful signal about individual work habits.
Role of Guarantees, Warranties, and Self-selection • Signaling to identify high quality and dependability • Effective decision tool because the cost of warranties to low-quality producers is too high • Set up carefully designed incentive structure & allow people self-selection: example of the ladder hypothesis of US historians
Moral Hazard • Determining the Premium for Fire Insurance • Warehouse worth $100,000 • Probability of a fire: • .005 with a $50 fire prevention program • .01 without the program • With the program, the premium is: • .005 x $100,000 = $500 • Once insured owners purchase the insurance, the owners no longer have an incentive to run the program, therefore the probability of loss is .01 • $500 premium will lead to a loss because the expected loss is not $1,000 (.01 x $100,000)
MC is the marginal cost of driving. With no moral hazard and assuming insurance companies can measure miles driven MC = MB at $1.50 and 100 miles/week--efficient allocation. With moral hazard insurance companies cannot measure mileage. MC to $1.00 and miles driven increases to 140 miles/week--inefficient allocation. MC MC’ D = MB (marginal benefit) Effects of Moral Hazard Moral hazard occurs when the insured party’s behavior changes after the fact to the detriment of the insurer. Cost per Mile $2.00 $1.50 $1.00 $0.50 0 50 100 140 Miles per Week
Moral Hazard in Medicare & Medicaid Demands from poor & elderly before & after subsidy DC’ S The non-covered group consumes less at higher price, but bears the tax burden, whereas the subsidized group as well as doctors benefit. DC Price of doctor’s visit($) Dn E’ 20 E 15 Dt’ =DC’ +Dn Dt =DC +Dn 6 12 Q=hundred million visits/ year 2 7 9 4 10
Main Features of the Principal--Agent Problem • Agency Relationship • One person’s welfare depends on what another person does • Agent • Person who acts & gets pre-contracted remuneration • Principal • Person whom the action effects – i.e., the residual risk-bearer
An Example of Principal--Agent Problem • Company owners are principals. • Workers and managers are agents. • Owners do not have complete knowledge. • Employees may pursue their own goals and reduce profits.
Observations on the Principal--Agent Problem in Private Enterprises • Only 16 of 100 largest corporations have individual family or financial institution ownership exceeding 10%. • Most large firms are controlled by management. • Monitoring management is costly (asymmetric information). • Managers may pursue their own objectives. • Growth • Utility from job • Limitations to managers’ ability to deviate from objective of owners • Stockholders can oust managers • Takeover attempts • Market for managers who maximize profits Do Golden Parachutes reward failure?
Observations on the Principal--Agent Problem in Public Enterprises • Managers’ goals may deviate from the principals’ goal (size) • Monitoring is difficult (asymmetric information) • Market forces are lacking • Limitations to Management Power • Managers choose a public service position • Managerial job market • Legislative and agency oversight Competition among agencies
Are non profit organizations more or less efficient than for-profit firms? • 725 hospitals from 14 hospital chains • Return on investment (ROI) and average cost (AC) measured Return on Investment 1977 1981 For-Profit 11.6% 12.7% Nonprofit 8.8% 7.4%
The Managers of Nonprofit Hospitals as Agents • After adjusting for differences in services: • AC/patient day in non-profits is 8% greater than profits • Conclusion • Profit incentive impacts performance • Cost and benefits of subsidizing non-profits must be considered.
Without shirking, the market wage is w*, and full-employment exists at L* No-Shirking Constraint SL Demand for Labor The no-shirking constraint gives the wage necessary to keep workers from shirking. At the equilibrium wage, We the firm hires Le workers, creating unemployment of L* - Le. we w* Le L* Unemployment in a Shirking Model Wage Quantity of Labor
Efficiency Wages at Ford Motor Company • Labor turnover at Ford • 1913: 380% • 1914: 1000% • Initial average pay = $2 - $3 • Ford increased pay to $5 • Results • Productivity increased 51% • Absenteeism was halved • Profitability rose from $30 million in 1914 to $60 million in 1916.
An Algebraic Expression for Efficiency Wages • g = p (we – w*) N, where g = marginal gain from shirking, we = efficiency wage rate w* = market-clearing wage rate N = time-horizon of the laborer => we = w* + g / (pN) => we > w* and further => we = f( W*, g, p, N) (+) (+) (-) (-)