Download
1 / 44
710 likes | 1.33k Vues
ENVIRONMENTAL RISK ASSESSMENT OF WASTE DISPOSAL FACILITIES. Arvind K Nema Department of Civil Engineering, I ndian I nstitute of T echnology, Delhi aknema@gmail.com. Introduction. Quantity of municipal solid waste (MSW) continues to grow in spite the efforts to reduce and recycle.

E N D
ENVIRONMENTAL RISK ASSESSMENT OF WASTE DISPOSAL FACILITIES Arvind K Nema Department of Civil Engineering, Indian Institute of Technology, Delhi aknema@gmail.com
Introduction • Quantity of municipal solid waste (MSW) continues to grow in spite the efforts to reduce and recycle. • Landfills play a significant role in the disposal of residual MSW in most developing countries. • An important factor, however, is the lack of basic epidemiological data on the health impact of prevailing waste management practices that would motivate and drive the authorities to adopt safer management techniques. • Little attention has been given on the health impacts of acute and chronic exposure due to MSW disposal facilities.
Objective and Scope • The objective of this study was to assess the ground level pollutant concentrations due to emissions from landfills and to estimate the associated human health risk. • The scope of the work was to assess the incremental lifetime cancer risk of inhalation exposure to emissions from a landfill. • Secondary data were used to estimate emission rate of pollutants from landfills. • A case study of Okhla landfill site of New Delhi, India is presented to demonstrate the utility of the methodology.
Risk Assessment Concepts • Risk assessment is the quantification of the potential for adverse effects due to chemicals released into the environment. • Risk = the probability of adverse consequence x severity of consequence • Risk is reported as a probability of occurrence, such as the chance of death per million or the lifetime cancer risk. • Risk assessment also requires an evaluation of the routes of exposure, dose, duration and the sensitivity of the receptor.
Risk Assessment Concepts… • Risk principles • Steps in risk assessment • Risk calculations
Exposure Assessment • Characterize Exposure Setting • Physical Environment • Potentially Exposed Populations • Identify Exposure Pathways • Chemical Source/Release • Exposure Point • Exposure Route Quantify Exposure Exposure Concentration Intake Variables Exposure
Estimation of Chemical Intakes • Chronic Daily Intake (CDI) • Daily Intake: DI (mg/kg-day) = C (mg/vol) * Intake (vol/day) / body mass (kg) • CDI = DI averaged over exposure • Lifetime average daily doseLADD = DI averaged over 70 year lifetime • Models for various exposure routes • Lots of factors, exposures • Typical or default values in databases
Estimation of chemical intakes: example • Air intake - on-site, commercial, adult • lifetime = 70 yrs • body wt. = 70 kg • inhalation rate = 20 m3/day (2.5 m3/hr x 8 hr/day) • concentration = 0.2 mg/m3 • DI = • CDI = • LADD = • note: absorbed vs. administered dose • exposure duration = 25 yrs • frequency = 250 days/yr
Uncertainties • Land use, ground water flow, characterization • Parameter uncertainty and sensitivity • Quantitative techniques for uncertainty and sensitivity • Confidence intervals • Monte-Carlo techniques • Health affects, toxicity parameters
Dose-Response Curves - Carcinogens 95% upper confidence limit extrapolation Humanexposure
Dose levels (animal studies) • NOEL no-observed effect level • NOAEL no-observed-adverse effect level • LOAEL lowest-observed-adverse effect level • MTD maximum tolerated dose • LD50 dose which kills 50% of population • LC50 concentration which kills 50% of population; must include time frame Increasing dose
Reference dose • is an estimate of the daily dose of a chemical that will avoid toxic effects other than cancer • The animal dose (NOAEL, LOAEL) is adjusted by uncertainty factors (UF) to allow for differences in sensitivity to chemicals. • Human data: UF = 10 • Animal data: UF = 100 (NOAEL), 1000 (LOAEL), 1000 (NOAEL, less data)
Reference dose (cont.) • RfD = NOAEL/UF 100 mg/kg-day / 100 = 1 mg/kg-day • Use RfD to establish allowed concentrations allowed C = RfD x body wt / daily intake= 1 mg/kg-day x 70 kg / 2 liters/day = 35 mg/l
Dose-Response Curves (non-carcinogens) % Response RfD NOAEL LOAEL Dose (mg/kg-day)
Example 1 • It is now 2011 and you, along with 400,000 residents of your community, find that for the last 35 years they have been drinking water that contains the chemical CIXOT. Although no one knew that this chemical was toxic until recently, the water treatment plant monitored for this chemical along with the suite of regulated chemicals. The average concentration over the last 35 years has been 4.6 μg/L. The cancer potency slope factor (also known as the potency factor) is 13.1 (mg/kg-day)-1. At this concentration of CIXOT, what would be the expected number of additional adult cancers in this community, using standard values for daily intake due to ingestion?
Example 2 • Suppose residents residing along a lake release a continuous flow of the carcinogenic herbicide, MTX, into a local lake. At steady state conditions and complex mixing, the concentration of MTX in the lake is 334 μg/L in the lake. The lake does not serve as a drinking water supply but many people swim in the lake. Suppose this carcinogen has an absorption potency (slope) factor of 0.71 (mg/kg-day)-1. Assume that the dermal uptake from water (PC) is 9.0 x 10⁻⁶ m/h. Assume that the average person swims in the lake five times per week for seven months each year for fifty-five years. The average lifespan is seventy years. This "average" person spends 1.25 hours in the lake each time he/she swims. The average available skin surface area is 1.89 m2. What is the absorbed dose in mg/kg-day?
Risk Estimation Methodology Landfill (historical data on waste quantity and its characteristics) Estimation of LFG (LandGEM model) Emission rate Emission factor ISCST3 dispersion model Meteorological data Ground level concentration Population data Individual cancer risk Population cancer risk
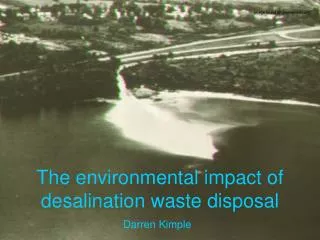
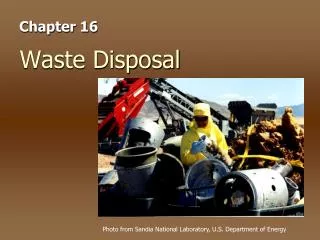
Accidental Fire in Waste Disposal Facilities • Fires occurring at landfill sites across are an ongoing but complex problem. • Landfill fires threaten the environment through toxic pollutants emitted into the air, water, and soil. • These fires also pose a risk to landfill workers and nearby receptors. • The degree of risk depends on the contents buried in the landfill, the geography of the landfill, and the nature of the fire. • There can be great difficulty in the detection and extinguishment of landfill fires, which is compounded because these fires often smoulder for weeks under the surface of the landfill before being discovered. • This study present paper aims to determine how various events are related and how they are linked to specific operational problems using logic diagrams like fault trees.
Issues related to Landfill Fire • Depending on the type of landfill and its contents, the smoke from a landfill fire may contain dangerous chemical compounds, which can cause respiratory disorders and other medical conditions. • Even if the smoke is benign, it can still aggravate existing respiratory conditions and reduce visibility around the landfill. • In addition, contrary to conventional thinking, the use of large amounts of water to suppress a landfill fire can actually make the fire worse by increasing the rate of aerobic decomposition, which increases the heat available inside the landfill. • Further, runoff from suppression efforts can overwhelm a landfill’s leachate collection system and contaminate ground or surface water sources.
Issues related to Landfill Fire.. • Fire may also compromise the structural integrity of a land-fill, posing a collapse hazard for personnel operating on the fire ground. • Landfill fires fall into one of two categories, surface and underground fires. • Depending on the type of landfill and type of fire, landfill fires can pose unique challenges to the landfill/ waste management industry and the fire service.
Characteristics of Landfill fires • Involve recently buried or un compacted refuse, situated on or close to the landfill surface in the aerobic decomposition layer. • These fires can be intensified by landfill gas (methane), which may cause the fire to spread throughout the landfill. • Generally burn at relatively low temperatures and are characterized by the emission of dense smoke and the products of incomplete combustion. • The smoke includes irritating agents, such as organic acids and other compounds. • When surface fires burn materials such as tires or plastics, the temperature in the burning zone can be quite high. • Higher temperature fires can cause the breakdown of volatile compounds, which emit dense black smoke.
Surface Fires • Fires associated with landfill gas control or venting systems • Fires caused by human error on the part of the landfill operators or users • Fires caused by construction or maintenance work • Spontaneous combustion of materials in the landfill • Deliberate fires, which are used by the landfill operator to reduce the volume of waste
Under Ground Fires • The most common cause of underground landfill fires is an increase in bacterial activity which raises temperatures (aerobic decomposition). • These so-called “hot spots” can come into contact with pockets of methane gas and result in a fire. • This can cause a build up of the by products of combustion in confined areas such as landfill site buildings or surrounding homes, which adds an additional health hazard. • Underground fires are often only detected by smoke emanating from some part of the landfill site or by the presence of CO in landfill gas.
Fault Tree Analysis (FTA) • A fault treeis a logic diagram that displays the inter-relationships between a potential critical event in a system and the reasons for, or causes of, this event.
Fault tree for Surface fires SURFACE FIRES AND Exposed combustible materials Favourable weather conditions Fire Sources OR OR OR Combustion of Materials Hot Parts contact with waste Windy conditions High ambient temp Partially covered waste Flammables not covered OR OR Reactions in waste and emission of gases Human error or deliberate fires Construction equipment Burning loads fromtrucks
Fault tree for Underground fires UNDER GROUND FIRES AND Oxygen supply in buried waste Heat Source OR OR Air through soil cover Overdrawing of Biogas from extraction wells OR Surface Fires High Temp of the buried waste Partially covered waste Unsatisfactory waste compaction
Unsatisfactory Waste Compaction OR Slopes are not compacted Properties of Waste OR OR Problem with steel wheel compactor Human error Water content to obtain min dry density of waste (475 Kg/m3 Operator errors OR OR Compactor teeth areworn out Wt. of compactor not match with waste Unsatisfactory no. of passes (<3 -4) over waste Ht of waste layers(>5m) during compaction Waste mixture during compaction
Results of fault tree analysis Probabilities of occurrence • Surface fires = 4.64E-03 • Underground fires = 5.91E-03 • According to probability scale table, the fires are occasional. Probability Scale
Risk Estimation • Incremental lifetime cancer risk = CDI x Potency factor • CDI (mg/kg-day) = Average daily dose (mg/day) / Body weight (kg)
Toxicity Data for Selected Potential Carcinogens(USEPA, IRIS (1989))