Download
1 / 41
410 likes | 668 Vues
Welcome to the MHQP & HealthForce MN Quality Brownbag Room Monthly Noon Brownbag Fourth Thursday Every Month. Aug 28 2008. DATA Requirements Governance Evaluating reporting aspects of software applications Organizing for the reporting function

E N D
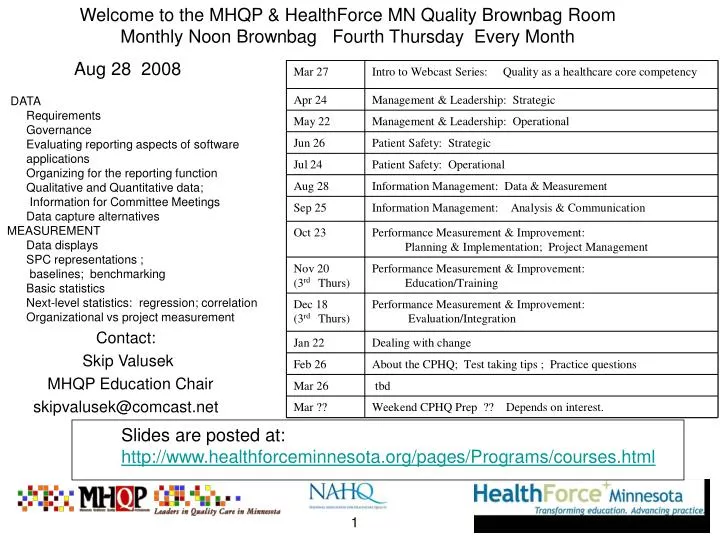
Welcome to the MHQP & HealthForce MN Quality Brownbag Room Monthly Noon Brownbag Fourth Thursday Every Month Aug 28 2008 • DATA • Requirements • Governance • Evaluating reporting aspects of software applications • Organizing for the reporting function • Qualitative and Quantitative data; • Information for Committee Meetings • Data capture alternatives • MEASUREMENT • Data displays • SPC representations ; • baselines; benchmarking • Basic statistics • Next-level statistics: regression; correlation • Organizational vs project measurement Contact: Skip Valusek MHQP Education Chair skipvalusek@comcast.net Slides are posted at: http://www.healthforceminnesota.org/pages/Programs/courses.html
Register your Attendance Hopefully you provided your name & organization when you signed in. • If so: Just say Hi in the Chat Pod and we’ll capture your name and organization in the log. • If not: identify yourself and organization in the Chat Pod to the left of your screen. If there are more than one attending on your sign-in, tell us how many by saying “Hi (tell us the number of attendees) “
Poll: Who is Attending this Session ? • Rural / Outstate ? • Metropolitan area ? • Organization that has (or serves) both ?
Healthcare system Hospital Clinic or Clinic System Long term care Healthplan Homecare / Hospice A Quality Support Organization Other ? (Identify other in Chat Pod) Poll: Who is attending: Organization Type ?
Poll: What do you hope to gain by participating? • I am a CPHQ and want to obtain CEU’s for recertification. (Note: this is not guaranteed at this time. We are still working on this) • I am a healthcare quality professional and am interested in additional education. • I am a healthcare professional interested in developing quality skills as a core competency. • I am a healthcare professional interested in learning more about healthcare quality.
Agenda • DATA • Requirements • Governance • Evaluating reporting aspects of software applications • Organizing for the reporting function • Qualitative and Quantitative data; • Information for Committee Meetings • Data capture alternatives • MEASUREMENT • Data displays • SPC representations ; • baselines; benchmarking • Basic statistics • Next-level statistics: regression; correlation • Organizational vs project measurement
Performance Assessment: Measuring Results • Quality Improvement • Early 1990’s TQM/QI • Collaborative culture • Focusing on processes • How customers define quality • Focusing on reducing variation • Shift from focus on individuals to focus on systems & processes 115-117 60
Requirements: Planning the Change(is an iterative process) Aims Measures Interventions
Seven Basic ConceptsData & Measurement Requirements • Healthcare data must be carefully defined & systematically collected & analyzed • Tremendous amounts of healthcare data & information available, but not all useful • Mature QI information revolves around clearly established patterns of care, not individual cases • Most quality indicators currently available are useful only as indicators of potential problems, not definitive measures of quality • Multiple measures of quality need to be integrated to provide a clear picture of quality of care • Developing outcomes information without monitoring the process of care is inefficient because it can’t lead directly to quality improvements • Cost and quality are inseparable 30-31
Data Governance • Planning and organizing • Anticipate barriers, identify responsibilities, lay groundwork for multidisciplinary collaboration • Develop data dictionary defining data elements & calculations; data stewards • Verifying and correcting • Identify data limitations; provide opportunity for correcting data & identifying opportunities for improving internal systems & review data 31
Poll: Who has identified data stewards for their critical data elements ? • What’s a data steward and where can I get one ? • We’ve talked about it a lot but have never been able to take action. • We have a few stewards who are responsible for the quality of their element(s) • We not only have stewards for many of our elements . . . . We also have a comprehensive data dictionary “owned” by the stewards.
Evaluating reporting aspects of software applications • Real Time “Reports” • Alerts (patient safety) & Reminders (best practices) • Efficiency of capture • Operational Reports (e.g. Patient lists) • Minimal impact on real time response time • Retrospective / Analytical “Reports” • Extract/Transform/Load Process • Data warehouse integration of: • clinical, • financial, • operational • Value analysis = Quality / cost
Organizing for the reporting function • Centralized • Minimize duplication • Best expertise against right data source(s) • Facilitates the reduction of island data bases • Distributed • Direct and “immediate” response • Often depends on personal relationships • Harder to push organization toward analytic maturity. • Often get different answers depending on who you ask
Quantitative Data • Two types of data • Continuous: Measurement (e.g. bedside monitors; arrival time; ) • Discrete: Counts & categories • Sampling, data collection & analysis is different for each type 39
Surgical Patient Preoperative Postoperative Gender Male Female Patient Education Received education brochure Didn’t receive brochure Discrete: Nominal Data
Nursing staff rank Nurse Level 1 Nurse Level II Nurse Level III Associate Degree Education BS MS PhD Attitude toward research scale Agree Neutral Disagree Discrete: Ordinal Data
Continuous Data • Scales theoretically have no gaps • Interval- • distance between each point is equal (e.g thermometer) • Ratio- • distance between each point is equal and there is a true zero (e.g. money) • Continuous data could be converted to count/categorical data (e.g. create histograms) • The critical issue is whether the right data are measured or counted • Much QI data is “surrogate measures” because they are easy to retrieve 40
Qualitative/ Subjective Data • e.g. • Patient Safety stories • Patient complaints and praises • Employee comments • Content analysis of comments • Difficult but powerful pattern recognition
Data Capture Alternatives • Data Collection Plan • Determine who, what, when, where, how, why ? • Choose & develop sampling method • Stratified Random Sampling-Divide population into stratas (subpopulations-sex, ethnicity, disease); each member of strata has equal probability of being selected • Cluster Sampling-Divide population into groups or clusters (studying medical students get list of medical schools) derive random sample • Who ? (Frequently overlooked until too late) • How? • Prospective capture (interview at time of care). • Manual abstraction • Structured report from EHR ? • Survey (web e.g. Survey Monkey; scan-able form) • Where? • Island excel databases (archipelago ?) • Duplication of (and errors in) data, especially ADT data ?
Poll: Who designs your surveys ? • Anyone that wants to. Sometimes quality is consulted for support in design and implementation. • Quality is responsible for all survey designs. • We have a “survey central” that is responsible (identify organizational entity in the chat pod). • Other (identify in the chat pod).
100% or Sample ?? • Population (N) total aggregate or group (all cases meeting a designated set of criteria) • Sample (n) a portion of the population representing the entire population • Sampling • Provides a logical way of making statements about a larger group based on a smaller group . . . Saves resources ! • Allows researchers to make statements or generalize from the sample to the population if the selection was random & systematic (unbiased) • This is one place you defer to your quality expert ! 41
Basic Sampling Designs: Types of Sampling • Probability-every element in the population has equal/random chance of being selected • Simple Random Sampling-each individual in sampling frame (all subjects in population) has an equal chance of being chosen • Systematic Sampling-After randomly selecting first case, draw every nth element from a population • Non probability sampling-no way of estimating probability of every element being included 41
Basic Sampling Designs: Types of Sampling • Convenience Sampling-Use of any available group of subjects; lack of randomization; atypical subjects • Snowball Sampling-Subtype of convenience sampling; subjects suggesting other subjects • Purposive/Judgment Sampling-Select particular group based on criteria; subjective; researcher uses own judgment to identify groups • Expert Sampling-Type of purposive sampling involving selecting experts in a given area due to access to relevant information • Quota Sampling-Make judgment decision about best type of sample; prespecifies characteristics of sample to increase representativeness 41-42
Sample Size • Factors influencing sample size: research purpose, design, level of confidence desired, anticipated degree of difference between study groups, population size • Larger sample, more valid & accurate the study; more representative of population • Smaller sample error of the mean-measure of fluctuation from one sample to another from same population 42
Measurements for Committee Meetings • Scorecards • Stoplight (ideally colors over time) • Detail via “drilldown” trends • Drill down interactively • By unit and shift • By day of week • By physician
Measurement: Data Displays • Identifying & Presenting Findings • How do data compare with other organizations? • What is the trend over time? • How are data likely to be interpreted? • Is there an opportunity for improvement? • Who should receive the data? • For what purpose? 31
Statistical Process Controls (SPC) representations • Use when you have valid statistical data and enough of it to calculate standard deviations (and assumes a normal distribution of your data). • Good for use with committees and with trends to detect when you need to do something • More in analysis & communication session in September
Baselines & Benchmarking • Baseline: Collecting that starting comparative • Often overlooked until opportunity is lost • Include in your data plan and do it early • Benchmarking: How do we know we’re the best ? • Compare to yourself: Only if everyone knows you’re the best; otherwise • Except for core measures, be prepared to pay for someone else to compile the data and sell it to you.
Basic Statistics • Mean; Median; Mode; 2 & 3 sigma SPC’s • Most data not sophisticated or accurate enough to provide much more. • Trends are the key. • Where possible look for shifting distributions (visual detection followed someday by statistical verification) 33-34
Planning the Change(is an iterative process) Aims Measures Interventions
Statistical Power of Different Data Types • Categorical data least powerful statistically (hypertensive/ non-hypertensive) • Continuous data have most power; need fewer data points (measured systolic & diastolic levels) 40
Next level statistics • Correlations & Regression analysis to “prove” relationship of variables. • Next month’s topic of analysis
Other Data considerations • Confidentiality • Delineation of specific information to which individuals have access • Protect records against loss, defacement, tampering, and unauthorized use • Risk Adjustment • Take into account/control the fact that different patients with same diagnosis might have additional characteristics that could affect response to treatment • Analysis of outcomes data takes into account & controls characteristics or conditions clinically meaningful & have demonstrated statistical effect on rates 19
Both raw & risk-adjusted data can be available for outcomes Handling outliers (are patients > 2 standard deviations deleted ?) Level of detail Best system includes every patient, practitioner, & payer Risk Adjustment 27
Organizational vs Project Reporting • Project data is much more suited to aims-measures-interventions and PDSA. Sometimes the project warrants status updates in organizational scorecards. • Both organizational and project reporting often intersect at Service Line quality improvement • Common issue to both: When/how does the data tell you to STOP ?
FYIUsing Data For Improvement: The Toolkit A Two Set DVD by Sandra Murray Available through NAHQ
Reminder to Register your Attendance Hopefully you signed in with your name & organization. • If so: say Hi in the Chat Pod and we’ll capture you in the log. • If not: identify yourself and organization in the Chat Pod to the left of your screen. If there are more than one attending on your sign-in, tell us how many by saying “Hi (tell us the number of attendees) “
Interest in CPHQ Prep Class in March 2009 ? • Registration would be around $150 for 1.5 days (Saturday and half day Sunday). • Would like to take this prep course in March somewhere in the Twin Cities? • Any interest in pairing you with a Twin Cities buddy to save on room expenses? Contact Skip
Next Session September 25 Information Management : Analysis & Communication • ANALYSIS • comparative data • Interpreting benchmarking data • Interpreting incidence/event reports • Interpreting outcome data • Intuition/stories vs objective/facts • COMMUNICATION • Event/individual patient issues • PI feedback processes • Reports - Scorecards - OLAP - mining • Right information for right audiences • Accrediting; boards; leaders; Dir & Mgr; Staff
Welcome to the MHQP & HealthForce MN Quality Brownbag Room Monthly Noon Brownbag Fourth Thursday Every Month Sep 25 Information Management: Analysis & Communication • ANALYSIS • comparative data • Interpreting benchmarking data • Interpreting incidence/event reports • Interpreting outcome data • Intuition/stories vs objective/facts • COMMUNICATION • Event/individual patient issues • PI feedback processes • Reports - Scorecards - OLAP -s mining • Right information for right audiences • Accrediting; boards; leaders; Dir & Mgr Questions? Contact: Skip Valusek MHQP Education Chair skipvalusek@comcast.net Slides are posted at: http://www.healthforceminnesota.org/pages/Programs/courses.html